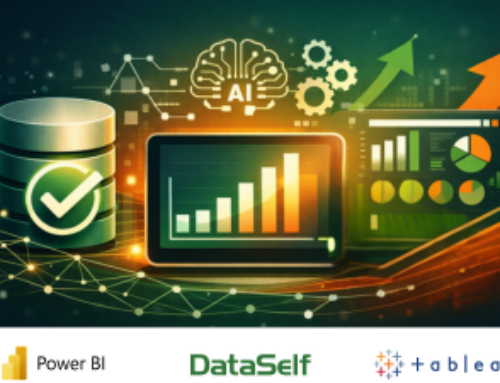
Beyond Data Visualization: The Missing Pieces Behind Claude, Power BI, Tableau, and OpenAI
 Organizations invest in Claude, Fabric Power BI, Tableau, MS Excel, OpenAI, and other business intelligence software expecting faster reporting, better visibility, and more informed decision-making. Yet many teams still struggle with slow dashboards, inconsistent KPIs, complex data preparation, and an overreliance on Excel reporting.
The problem is rarely the visualization tool itself.
These tools all excel at presenting information, but they depend on having clean, structured, analytics-ready data beneath them. Without a strong data foundation, organizations often experience:
- Slow report performance and long dashboard load times
- Conflicting metrics across departments
- Manual data preparation and spreadsheet workarounds
- Lengthy BI implementations
- Dependence on technical resources for report creation
- Difficulty establishing a single version of the truth
DataSelf solves these challenges by building that strong foundation with automated data warehousing, AI-assisted data modeling, and over 8,000 pre-configured KPIs and dashboards. The result is faster deployment, more trusted analytics, and significantly improved ROI from your business intelligence investment.
1. Eliminate Data Silos and Create a Single Version of the Truth
The quality of your analytics depends on the quality of your data. Visualization tools can only visualize what they are given. If the underlying data is fragmented, inconsistent, or trapped in separate systems, dashboards become slow, difficult to maintain, and potentially misleading.
DataSelf’s ETL+ platform automatically extracts, transforms, and loads data from more than 430 source systems from ERP and CRM, to accounting and other business applications into a centralized, performance-optimized data warehouse. During this process, data is standardized, cleansed, and structured to ensure consistency across all reports and dashboards.
The result is faster reporting, improved dashboard performance, and a trusted single version of the truth that executives, managers, and analysts can rely on with confidence.
Instead of spending time reconciling conflicting reports, organizations gain a foundation for automated reporting, self-service analytics, and more informed business decisions.
2. Reduce BI Implementation Time with AI-Assisted Data Modeling
One of the biggest barriers to successful business intelligence projects is the time and expertise required to prepare data for analysis.
Most organizations assume AI-powered analytics begins and ends with natural-language querying (questions and answers). DataSelf takes AI much further by automating the design and development process behind the scenes with built in DFT+ (Dimension, Fact and Time) data modeling.
DataSelf’s AI-Assist technology helps both technical and non-technical users accelerate report development by:
- Automating data modeling
- Identifying relationships between business entities
- Creating calculations and hierarchies
- Generating sophisticated SQL queries
- Building analytics-ready schemas
DFT+ automatically identifies core business entities such as customers, products, vendors, inventory, and sales transactions. It then determines how these elements relate to one another and generates ready-to-use star and galaxy schemas in minutes.
What traditionally requires weeks of effort from developers, consultants, or data analysts can often be completed in hours.
The result is a faster BI deployment, lower implementation costs, and a scalable analytics foundation that supports any data visualization platform you choose from traditional applications like Fabric Power BI, Tableau, & MS Excel; to AI tools such as Claude and OpenAI.
3. Accelerate Time-to-Value with Pre-Built KPI Dashboards and Reporting Templates
Once data is clean and properly modeled, organizations face another challenge:
- Which KPIs should be measured?
- What reports should executives see?
- Which dashboards drive meaningful action?
Many business intelligence initiatives stall because teams spend months designing reports before delivering value to end users.
DataSelf eliminates this bottleneck with a library of more than 8,000 pre-configured KPIs, dashboards, and reporting templates designed for common business processes and industries.
These include:
- Executive dashboards
- Financial reporting
- Sales analytics
- Inventory reporting
- Customer analytics
- Operational performance metrics
- ERP reporting dashboards
Organizations can begin generating insights immediately instead of waiting for custom reports to be built from scratch.
Even better, because every KPI and dashboard remains fully customizable, users can leverage DataSelf’s no-code, low-code, and full-code capabilities to tailor analytics to their unique requirements. Embedded AI assistance further simplifies customization, allowing business users to adapt reports without extensive technical expertise.
This dramatically accelerates time-to-value while helping standardize metrics across departments and business units.
4. Transform Claude, Fabric Power BI, Tableau, MS Excel, OpenAI into Self-Service Analytics Platforms
When organizations combine clean data, automated data modeling, and ready-to-use KPI dashboards, analytics platforms become significantly more powerful.
Benefits include:
- Faster dashboard load times and report performance
- Consistent KPIs across departments
- Reduced dependence on IT, developers, and consultants
- Greater adoption of self-service analytics
- Faster answers to business questions
- More trusted decision-making
- Improved ROI from business intelligence investments
Rather than spending time preparing data or validating numbers, users can focus on analyzing trends, identifying opportunities, and taking action.
The result is a business intelligence that empowers everyone – from executives and managers to frontline users – to explore data confidently and independently.
Learn more about:
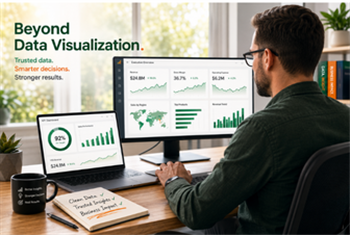
Beyond Visualization: Building a Foundation for Trusted Analytics
Data visualization tools are powerful tools, but they do not solve reporting challenges on their own. Organizations need clean, trusted data, consistent metrics, and a scalable analytics foundation to realize the full value of their BI investment.
By combining automated data warehousing, AI-assisted data modeling, and thousands of pre-built KPI dashboards, DataSelf helps organizations eliminate reporting bottlenecks, reduce implementation time, and deliver faster, more reliable business intelligence.
The result is more than better dashboards. It is faster reporting, trusted analytics, greater self-service capabilities, and measurable ROI.
If you’re tired of struggling with slow reports, data visualization performance issues, inconsistent KPIs, Excel hell, and a lack of trust in your data – we can help. Contact us today for a free Business Intelligence review.