Construction Dashboards – Samples
Interactive and insightful construction dashboards for every situation.
DataSelf Analytics for Construction provides dashboards that are easy to configure so you see your data your way. From any dashboard, you can go to the underlying ERP data with just one click.
Advanced Analytics by DataSelf
Construction Edition
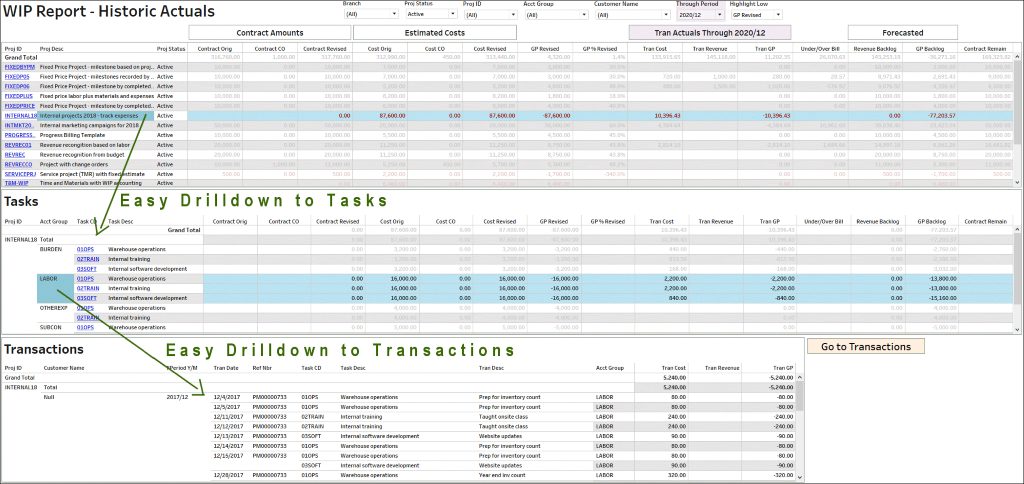
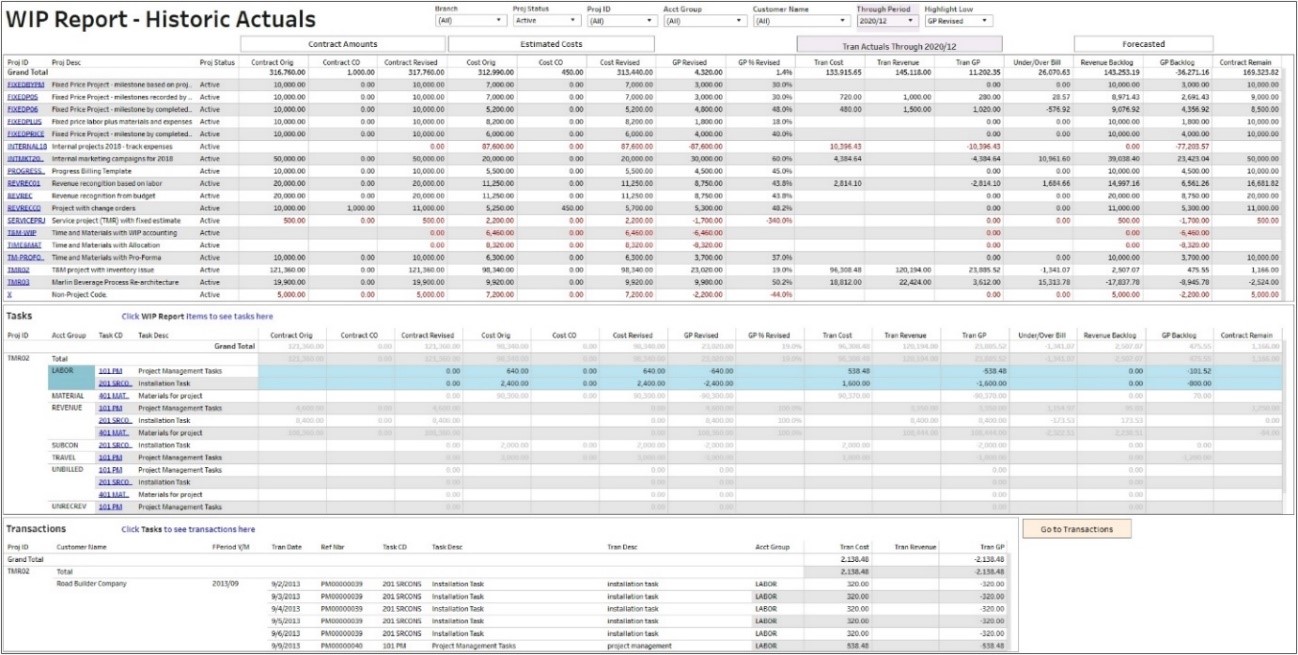
WIP Reporting
Extensive WIP Reporting with one-click drill-down to tasks and transactions.
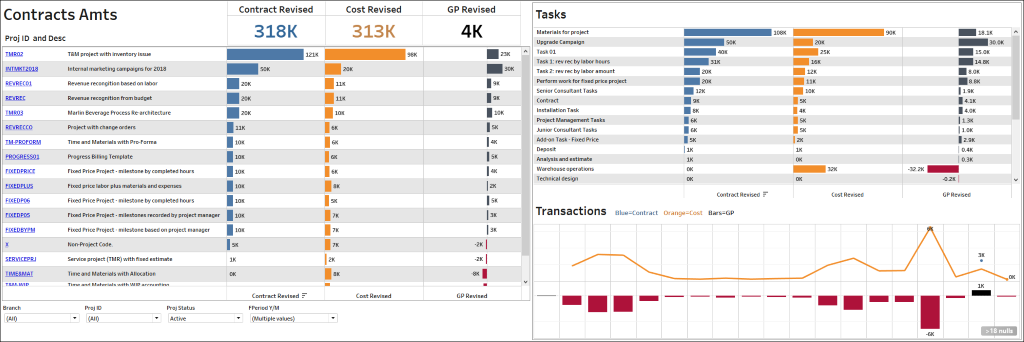
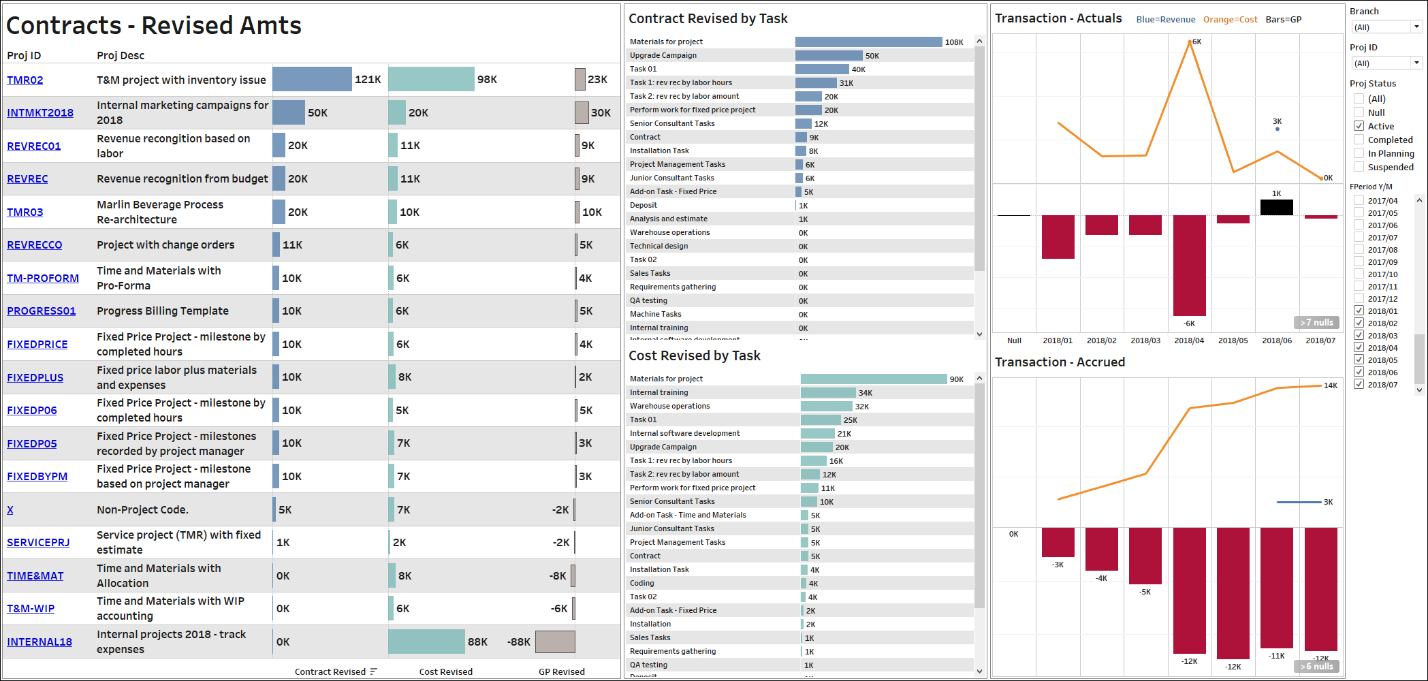
Contract Dashboard
Insightful and easy ways to spot how contracts and tasks are affecting the bottom line.
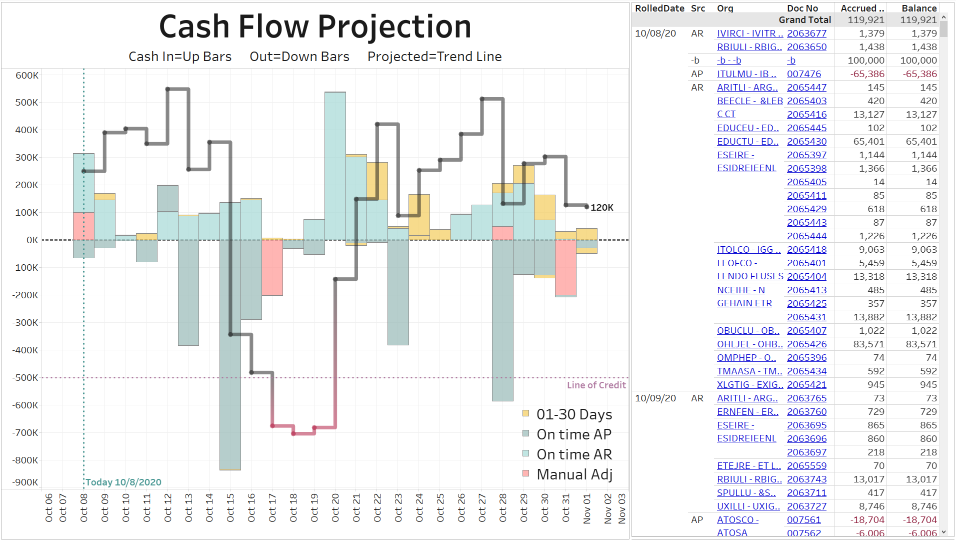
Cash Flow Projection
Slice and dice and do what-if cash flow projection scenarios.
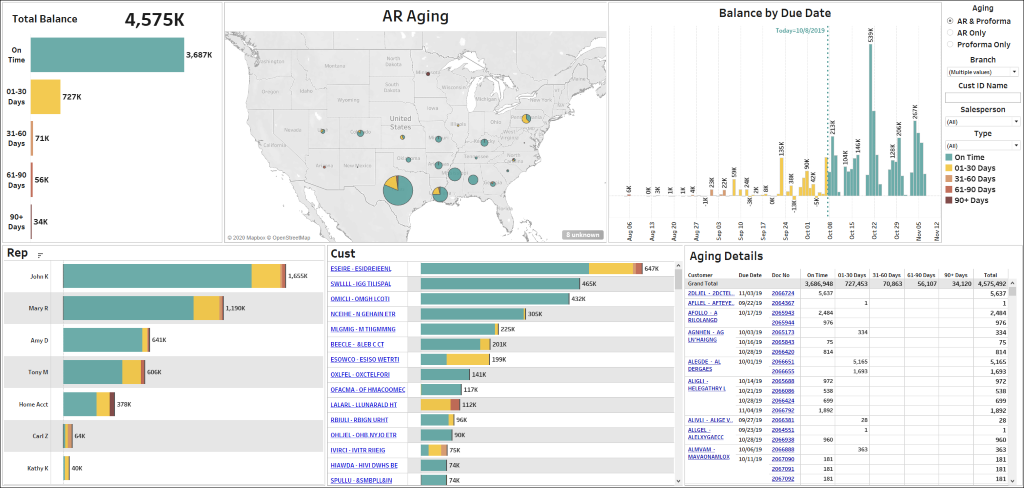
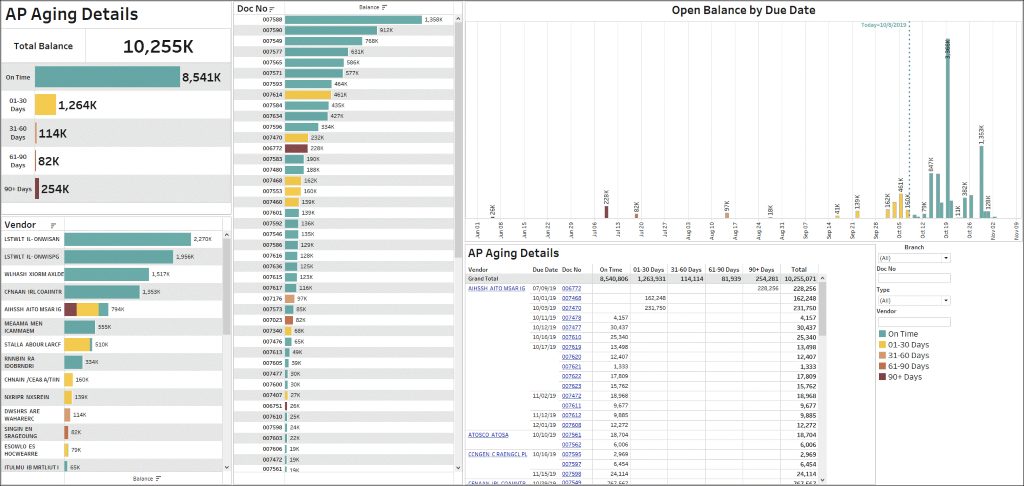
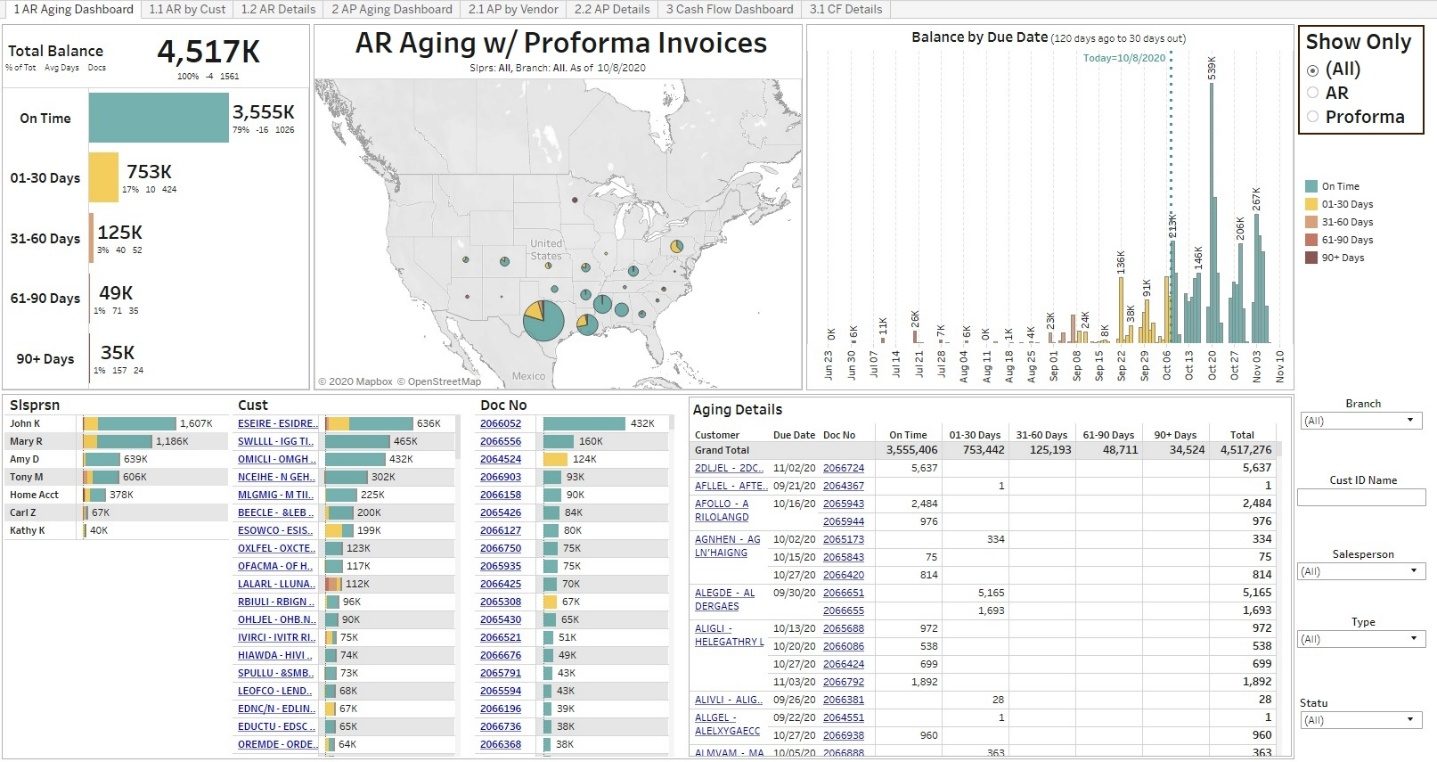
AR Aging (with Proforma – optional)
Easily combine AR Aging with proforma invoices for a more complete view of receivables.
Payables
Easy analysis of payables trends.
Year-Over-Year Sales
Easy and extensive ways to slice and dice sales information.
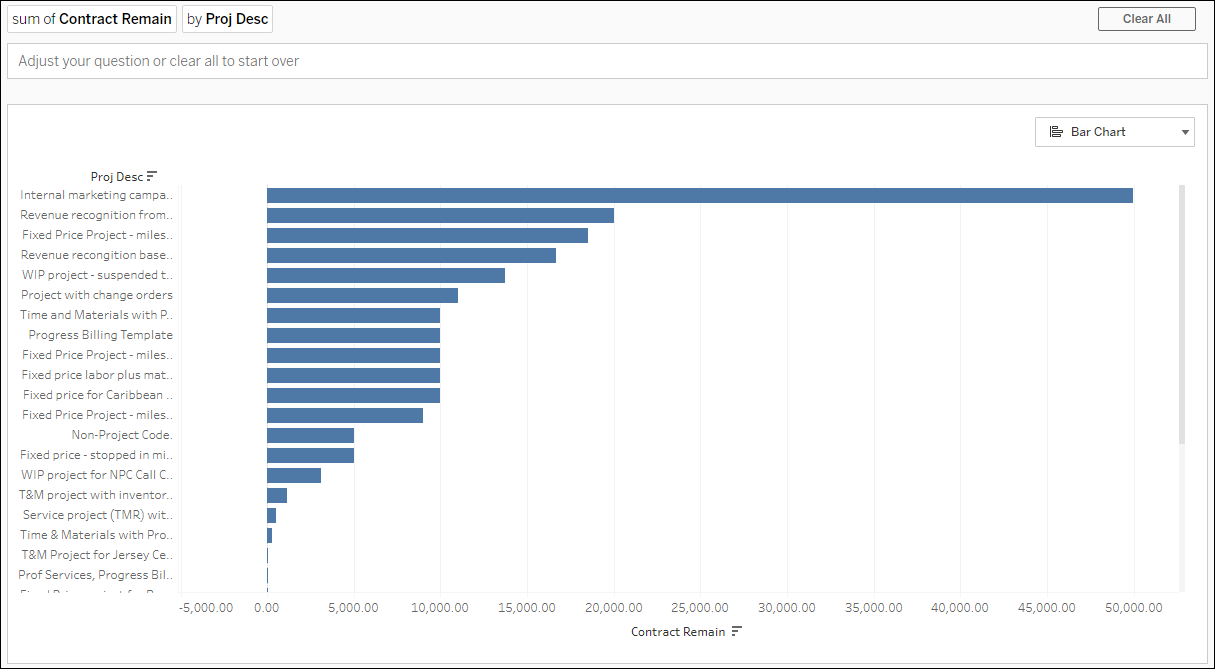
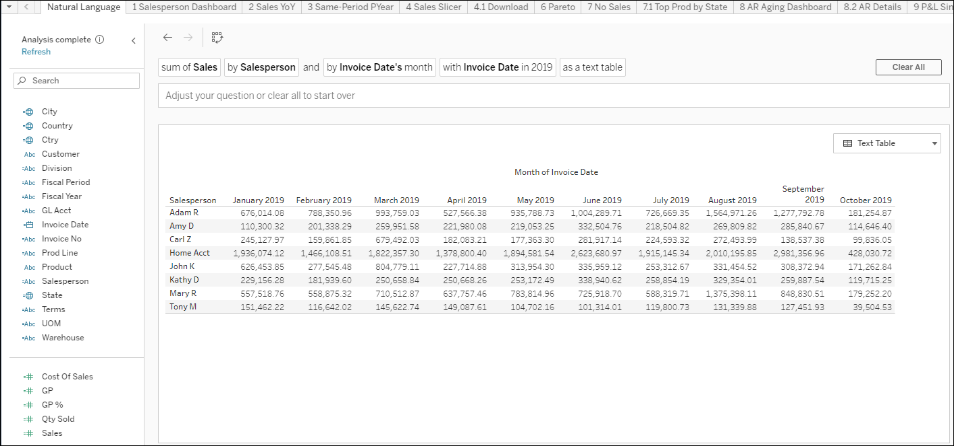
Natural Language Query (NLQ)
Like searching on the internet, type in keywords about your data and an instant and accurate report is created.
Searching for “Contract Remain Amt by Project” yields:
Searching “Sales by Salesperson by Month in 2019 as a text table” yields:
Actual dashboards might be slightly different.
All dashboards above are also included with Enterprise Analytics by DataSelf.
Enterprise Analytics by DataSelf
Construction Edition – Sample Templates
These templates have a wide range of configuration possibilities to adapt to unique business needs. Actual templates might vary. Some might require additional configuration not included in SOWs unless specifically described.
Contracts, Project Accounting, and WIP
There are 50+ templates offering a wide range of configuration possibilities to adapt to unique business needs. Actual templates might vary. Some might require additional configuration not included in SOWs unless specifically described.
WIP Report (also in Advanced Analytics)
Extensive WIP Reporting with one-click drill-down to tasks and transactions covering current data as well as historical actuals.
Contract Dashboard (also in Advanced Analytics)
Insightful and easy ways to spot how contracts and tasks are affecting the bottom line.
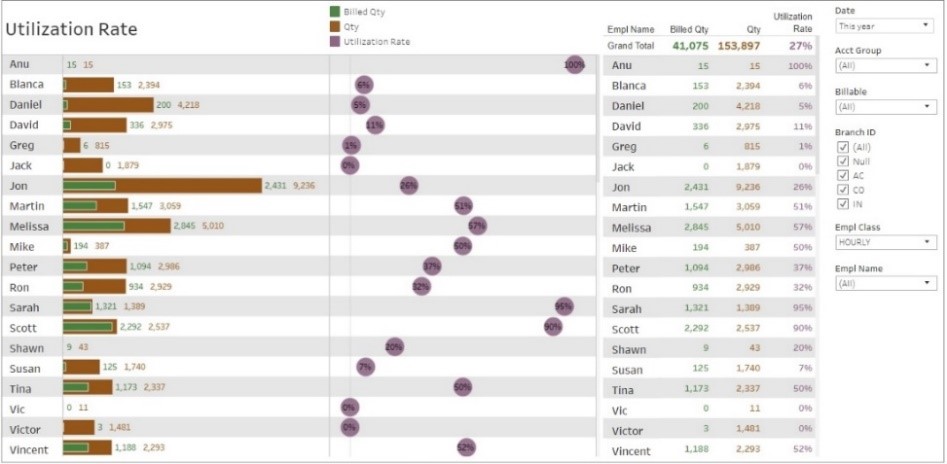
Utilization Rates
Easily monitor workers utilization rates. Drill down options can reveal trends to assist in keeping your workforce productive.
AR Aging with Proforma(also in Advanced Analytics)
Easily combine AR Aging with proforma invoices for a more complete view of your cash flow.
Cash Flow Projection (also in Advanced Analytics)
Allows users to easily slice and dice and do what-if cash flow projection scenarios.
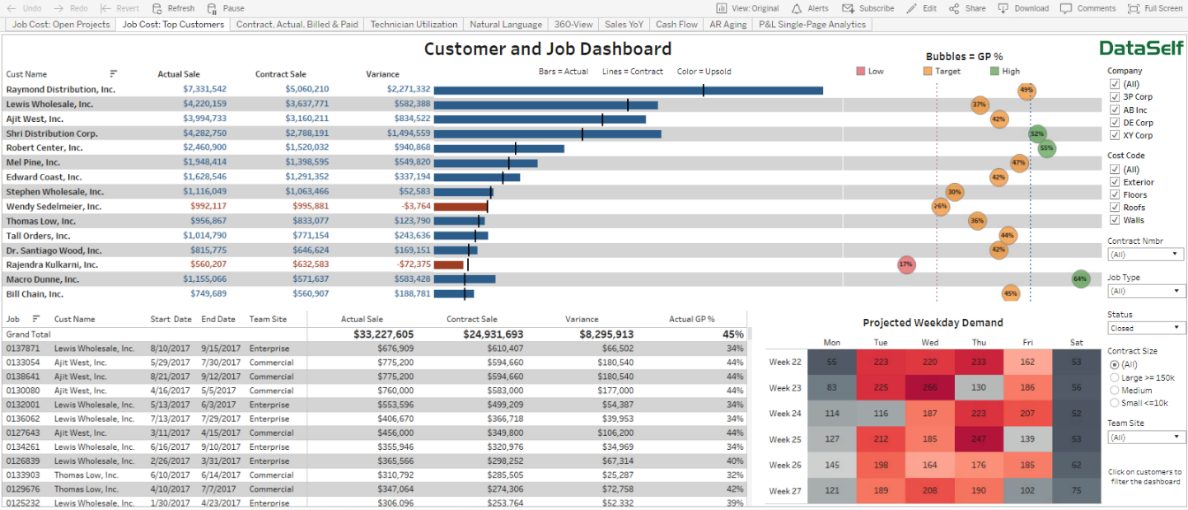
Customizable Dashboards
Easy to create custom views of your data such as scheduling and profitability by customer, project, division, etc.
Core Financials: AP, AR, and GL – Optional
There are 1,000+ templates offering a wide range of configuration possibilities to adapt to unique business needs. Actual templates might vary. Some might require additional configuration not included in SOWs unless specifically described.
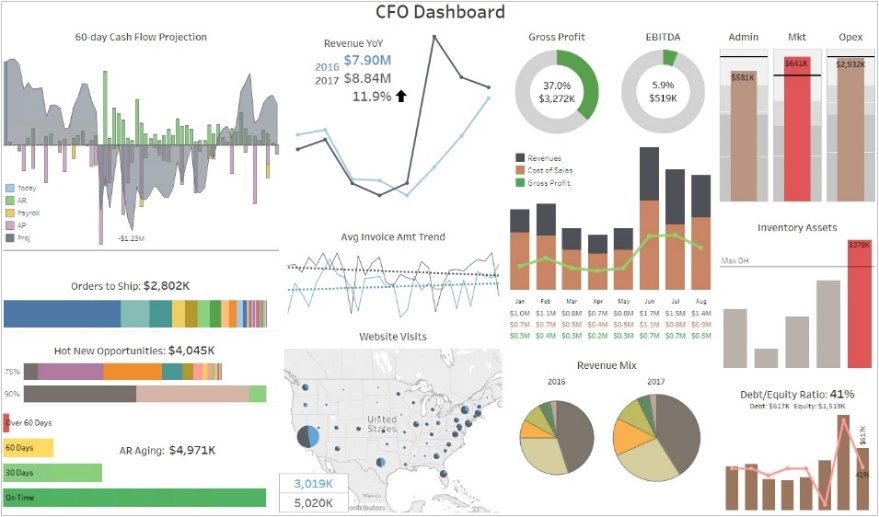
360-View Dashboards (a couple included with Advanced Analytics from a single data source):
KPIs from different systems such as the ERP, CRM, Google Analytics, Payroll, and Excel. Clicking on a KPI will drill down into more details. Dashboards like this are usually tailored for C-level executives based on their specific KPI needs.
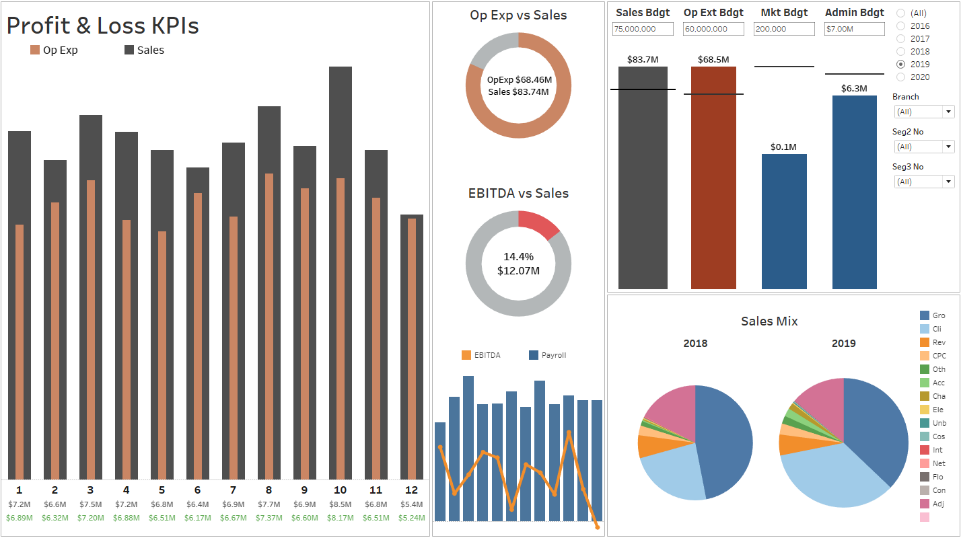
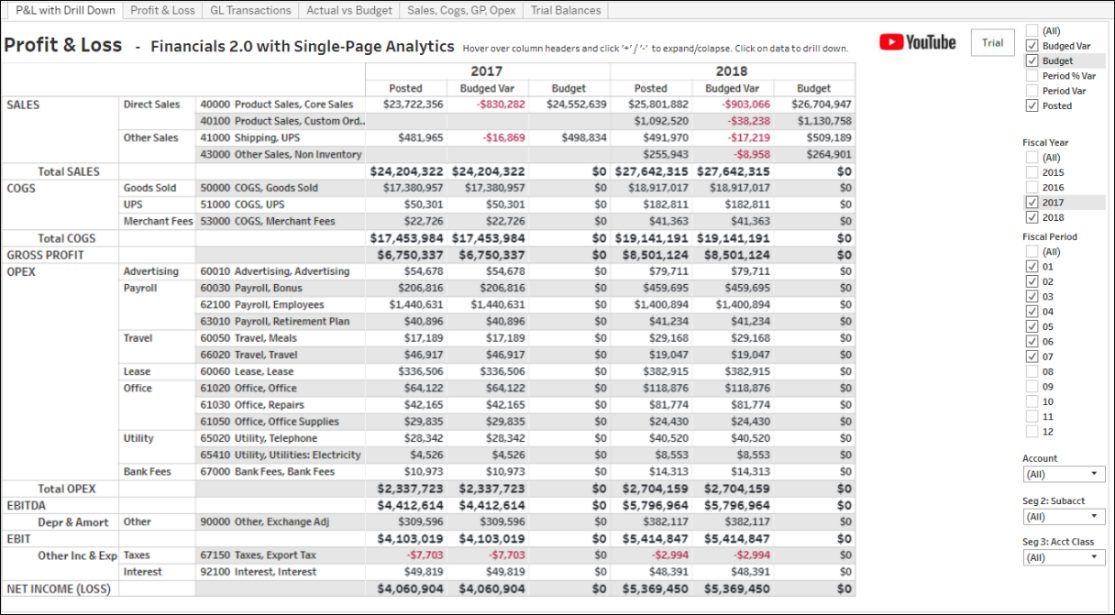
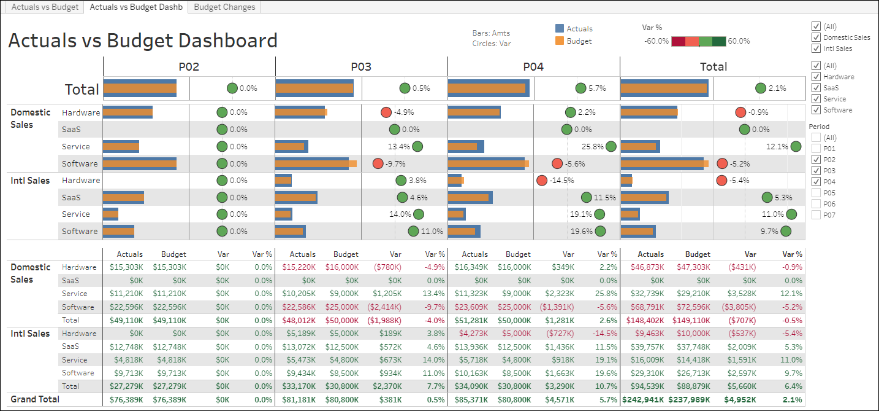
This is a preconfigured P&L Dashboard that can be easily adjusted. Budget amounts can come from the ERP, Excel, or user-input.
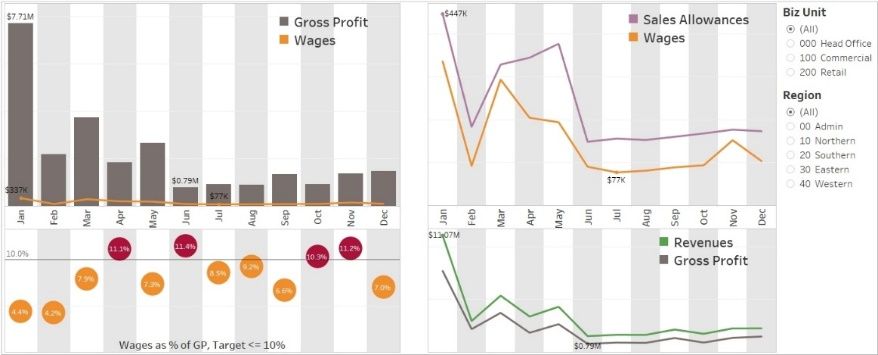
Financial KPIs and Ratios
Dozens of pre-configured dashboards provide insights into financial KPIs from P&L and Balance Sheet. The example below focuses on wage ratios against other metrics.
This template shows P&L by month across years.
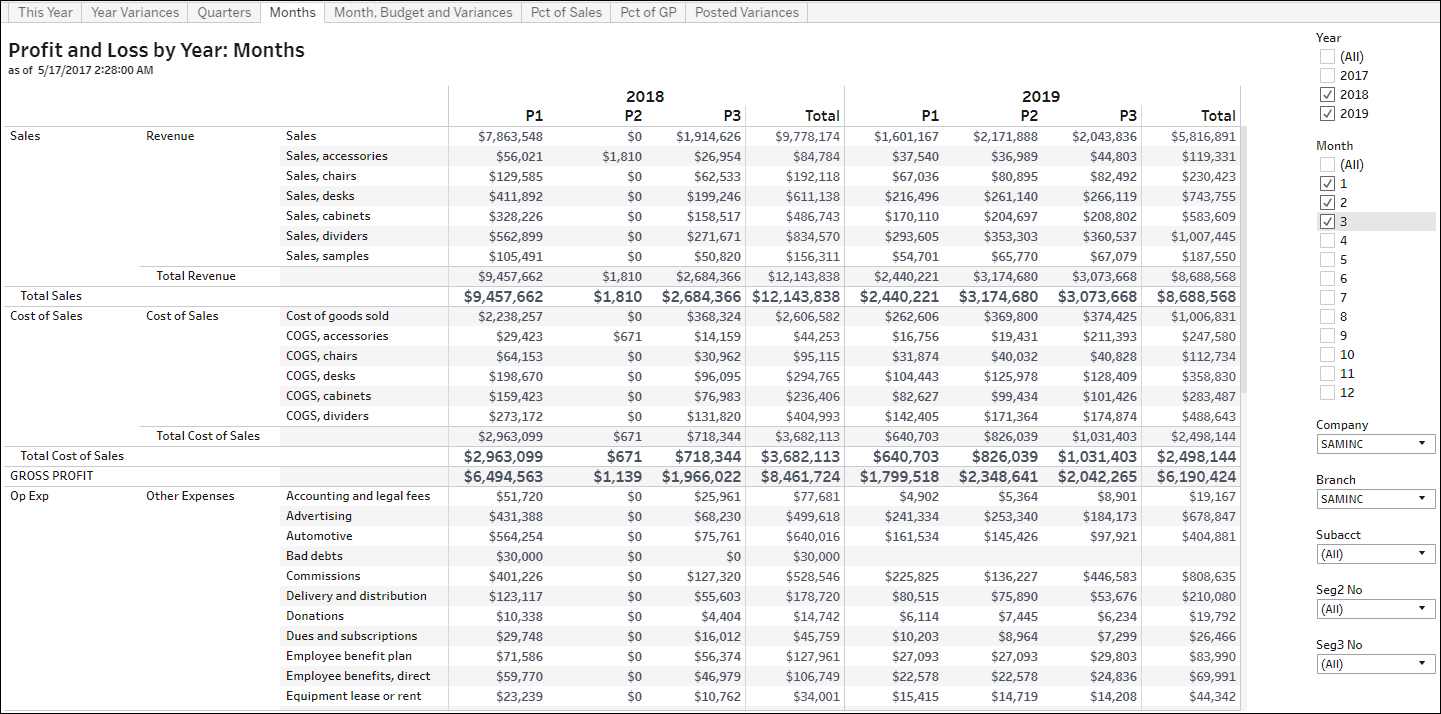
Profit and Loss Reports: Extensive library of P&L reports with easy slicing and dicing.
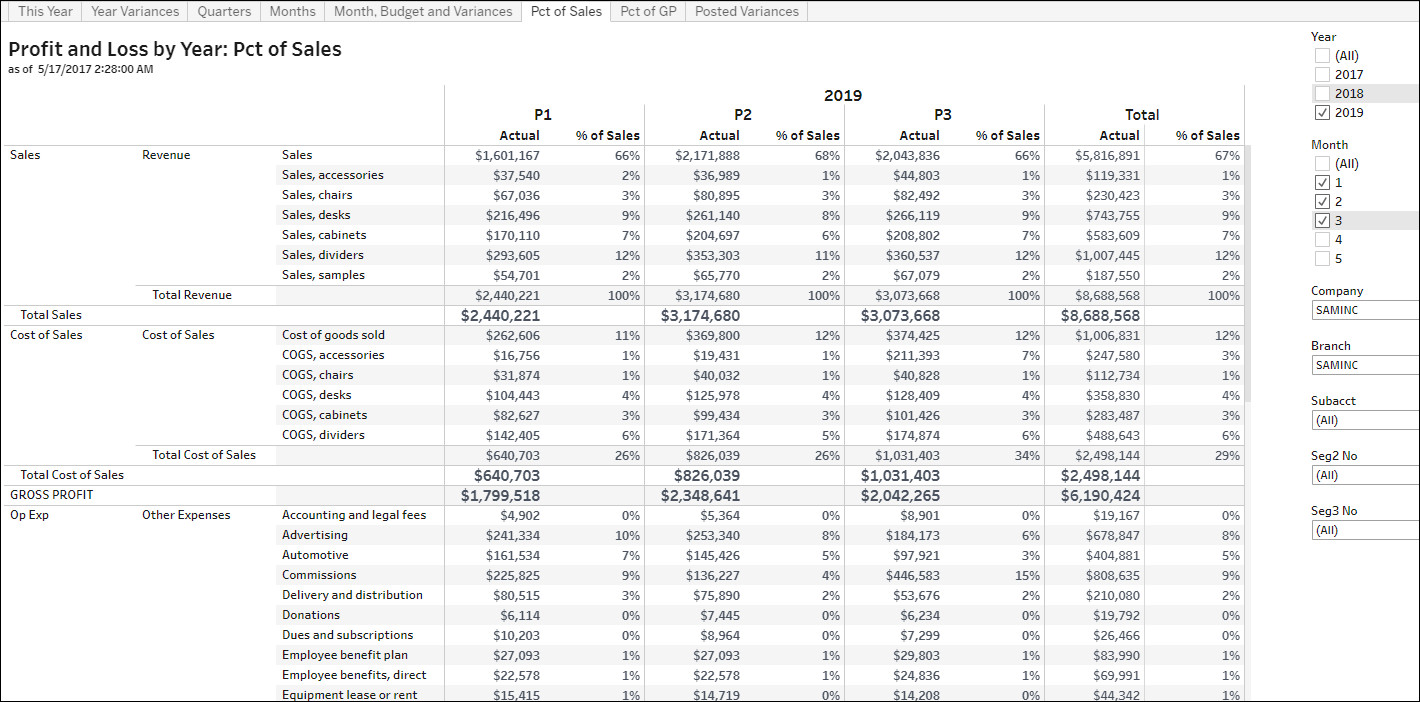
Percent of a Metric
Keeping track of your financials against your sales (revenues) or gross profit or other metrics can quickly highlight important trends. For instance, why marketing expenses are trending up against their percentage of sales.
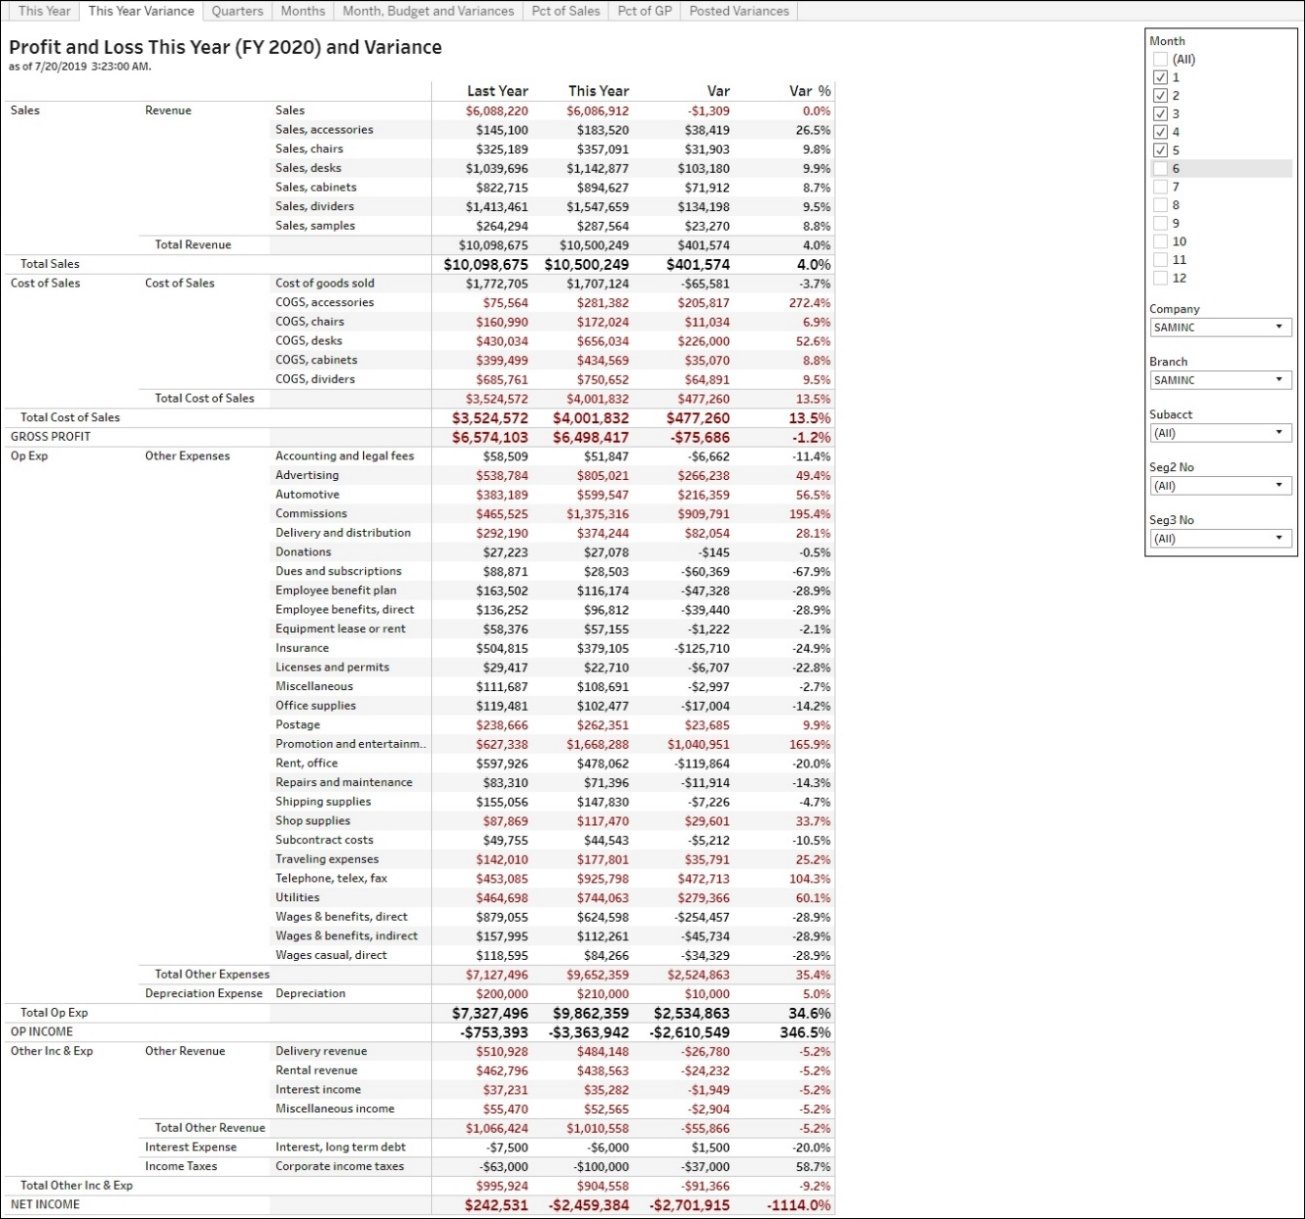
Single-Page Analytics provides extensive ways to slice and dice financials on a single page. Users can easily select periods, measures (such as budget and variances), and drill down all the way to GL Batch information—everything on a single page.
Watch our 2-min video at https://www.youtube.com/watch?v=UhSmNp1SNcs.
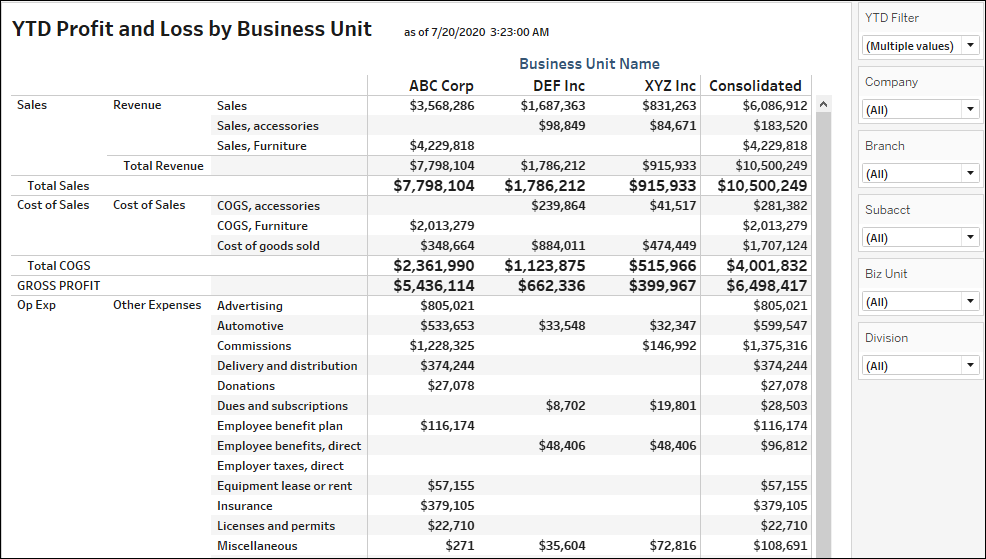
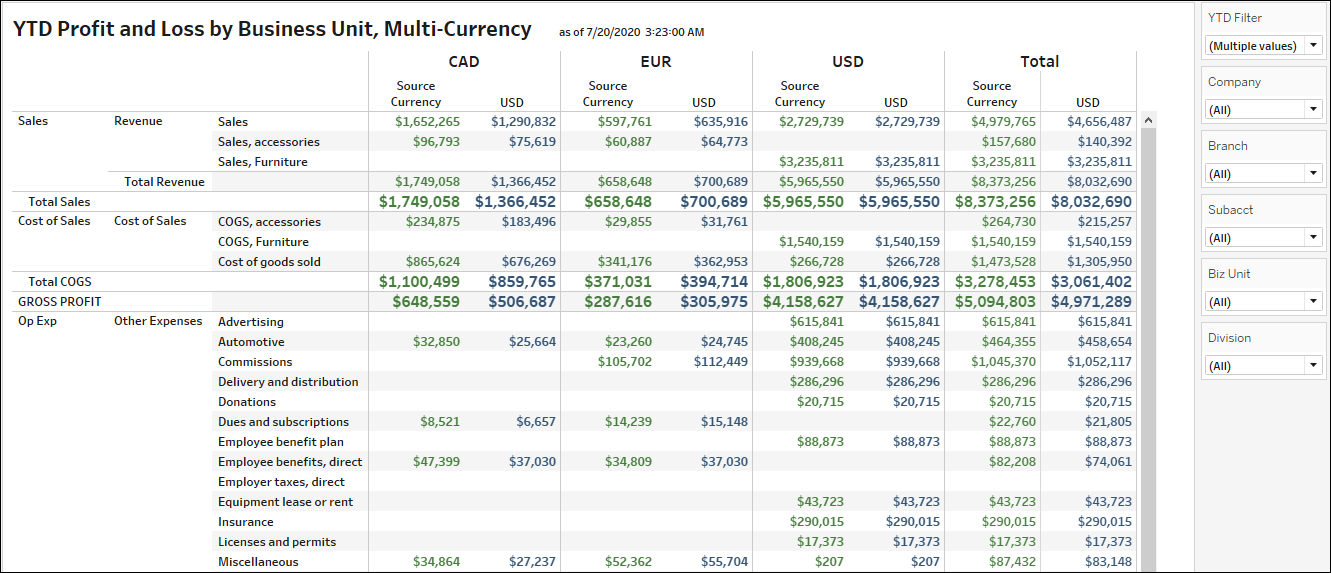
Multi-Company Environment: DataSelf provides comprehensive ways to consolidate data from multi-company systems. The data is normalized and consolidated in the DataSelf data warehouse, and then it becomes easy and fast to report from single companies, groups of companies, or across all of them. The example below shows 3 business units and the consolidated total.
Multi-Currency Consolidation: DataSelf provides comprehensive ways to consolidate multi-currency systems. The data is normalized and consolidated in the DataSelf data warehouse, and then it becomes easy and fast to report on single or multiple currencies. The example below shows the financials from 3 business units working with different currencies, how they relate to the consolidated currency USD, and the total.
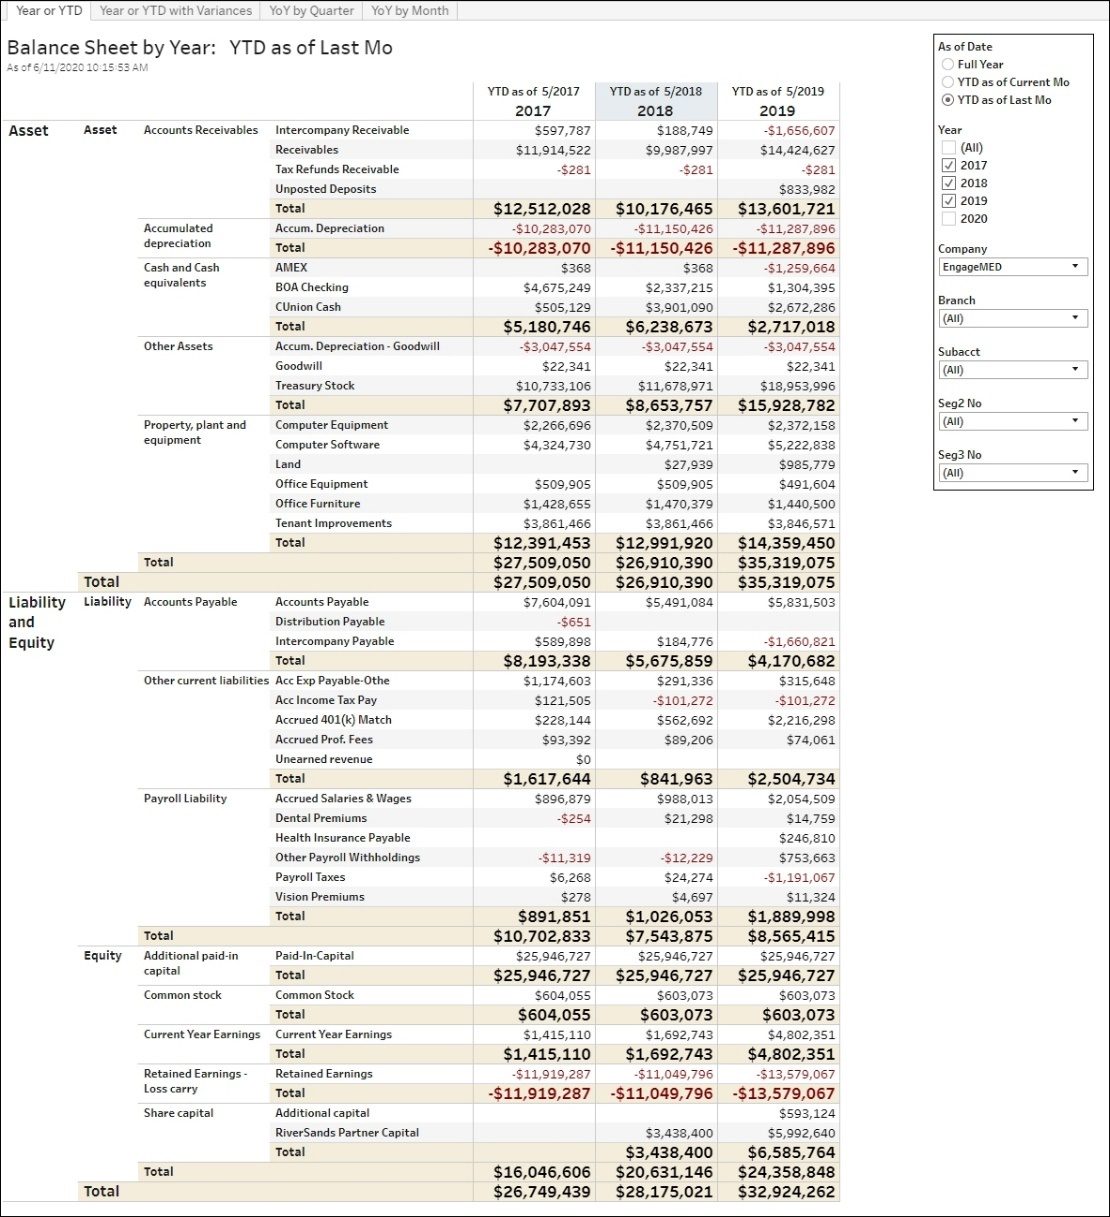
Balance Sheet: Extensive library of Balance Sheet reports with easy slicing and dicing. These templates have a similar framework of the P&L reporting above.
AR Aging with Proforma (also in Advanced Analytics): Easily combine AR Aging with proforma invoices for a more complete view of your cash flow.
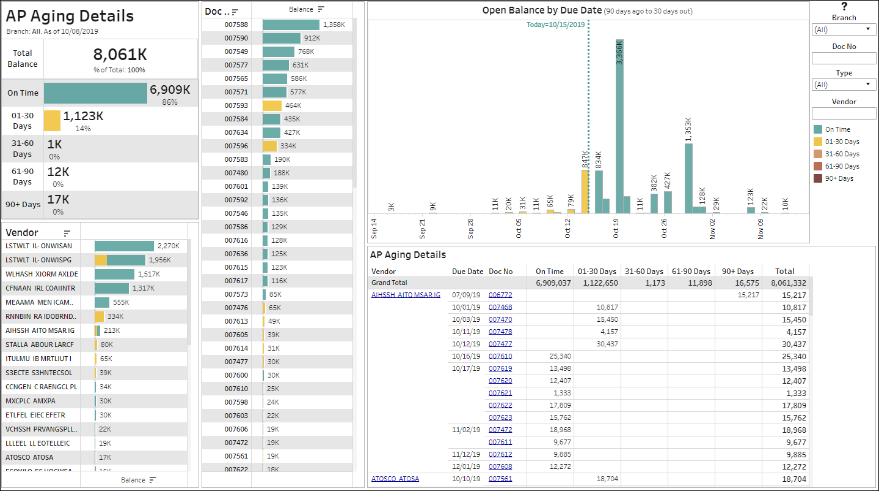
Payables (also in Advanced Analytics): Hundreds of Payables reports and dashboards allow users to quickly visualize and analyze AP trends. The dashboard below gives an overview of AP by total, vendor, due date, bill and all details. Selecting data points filters the dashboard.
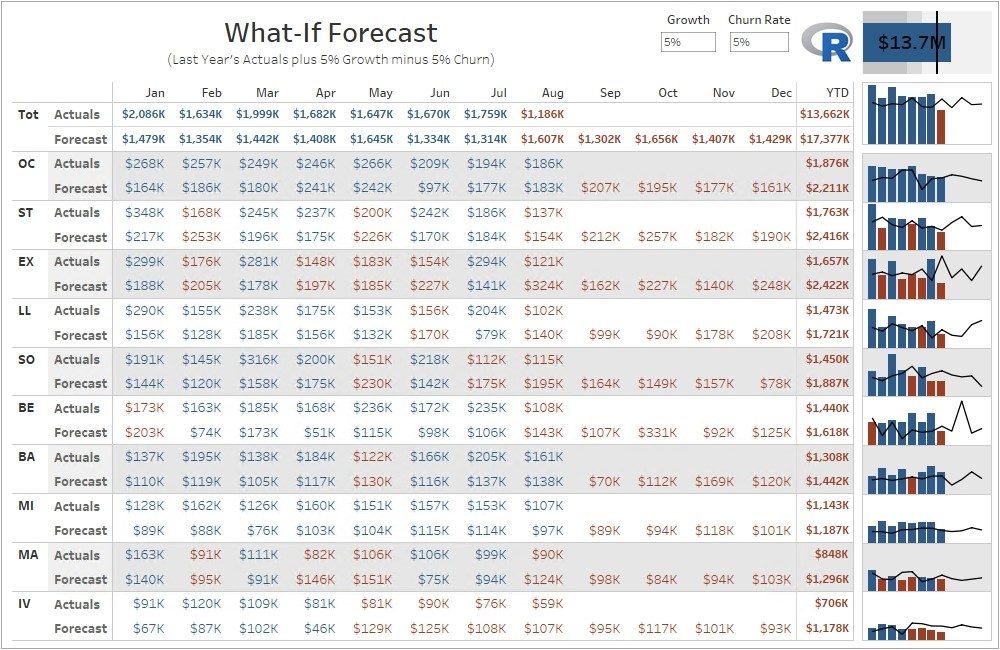
Budgeting: DataSelf can combine actuals data with budgets coming from your source system, or Excel files, or directly from user input. Setting up Budgeting and Forecasting requires an understanding of the client’s specific needs, and might require additional configuration not included in SOWs unless specifically described.
Forecasting: When working with high data volume, DataSelf can leverage tools such as MS SQL Server, Tableau, Power BI and R to allow companies to tackle complex statistical algorithms for forecasting.

Distribution: Sales, SO, Inventory, and PO – Optional
There are 5,000+ templates offering a wide range of configuration possibilities to adapt to unique business needs. Actual templates might vary. Some might require additional configuration not included in SOWs unless specifically described.
Salesperson Dashboards (one also in Advanced Analytics):
Extensive and easy ways to slice and dice critical sales information.
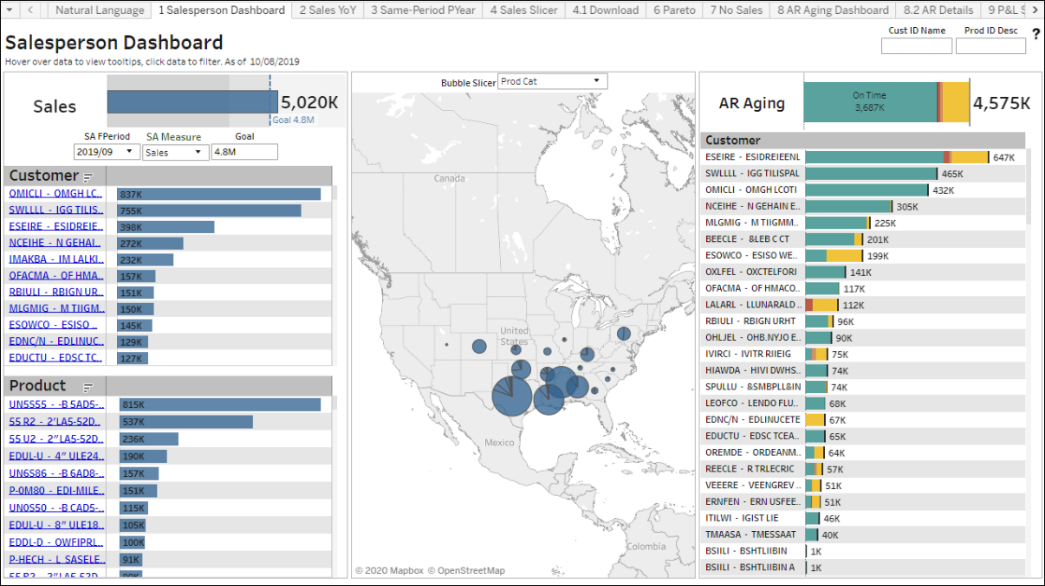
The following dashboard combines data from ERP and CRM (when available).
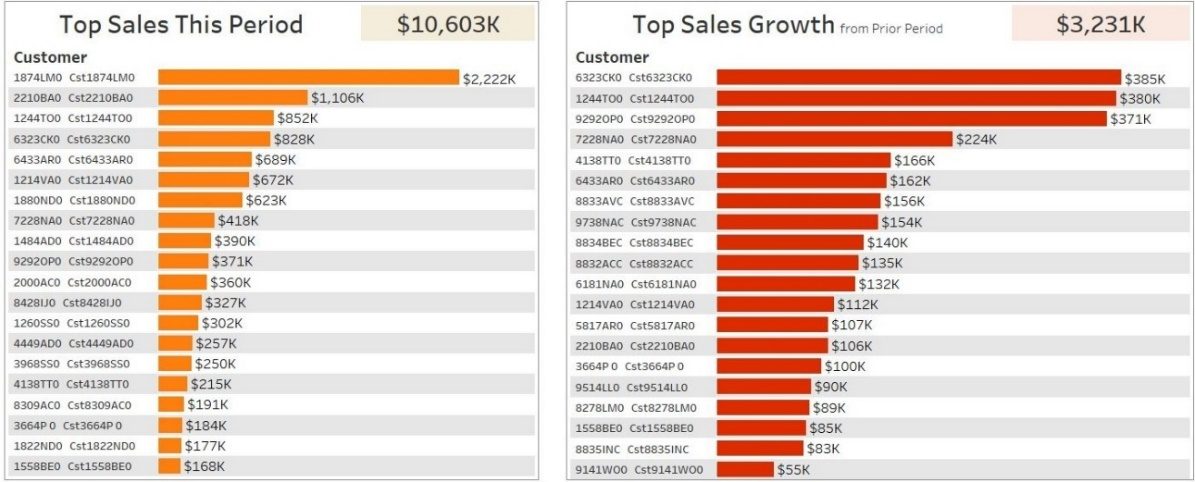
Top (and Bottom) Performers
Several views to analyze the top and bottom performers across different data sets such as customers, products or projects. and regions.
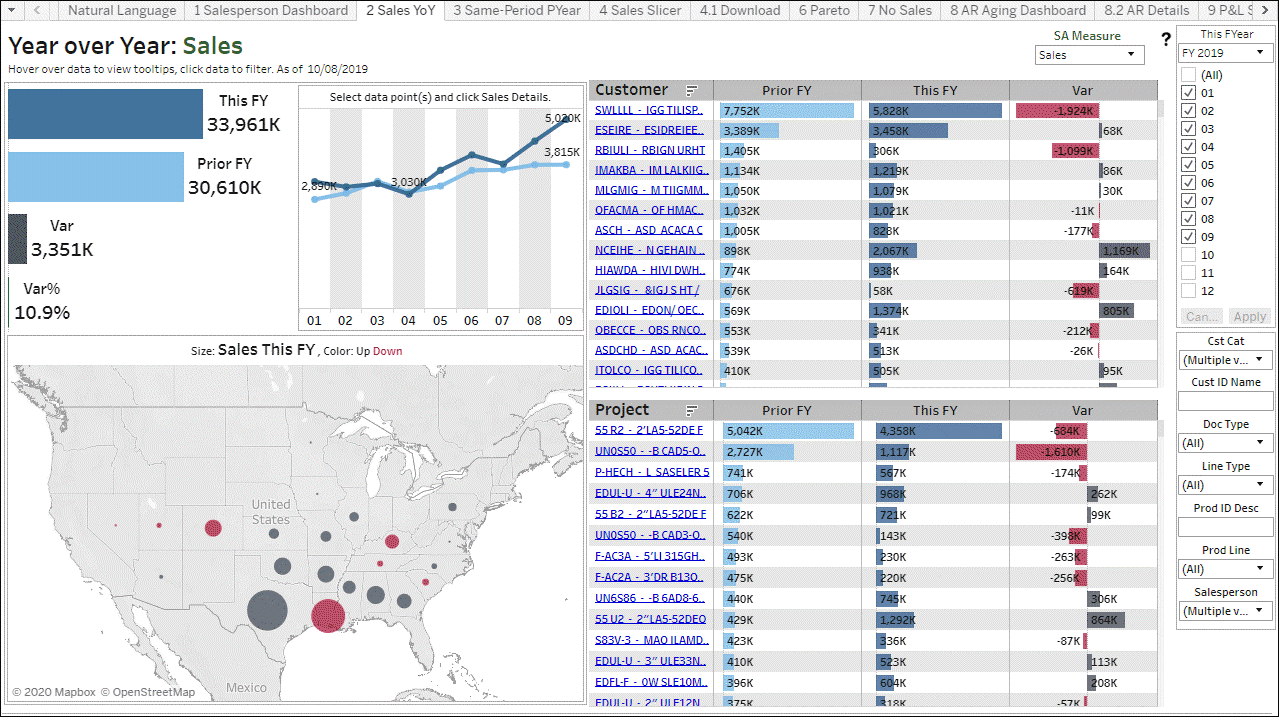
Year-Over-Year (also in Advanced Analytics): Easy and extensive ways to slice and dice sales information
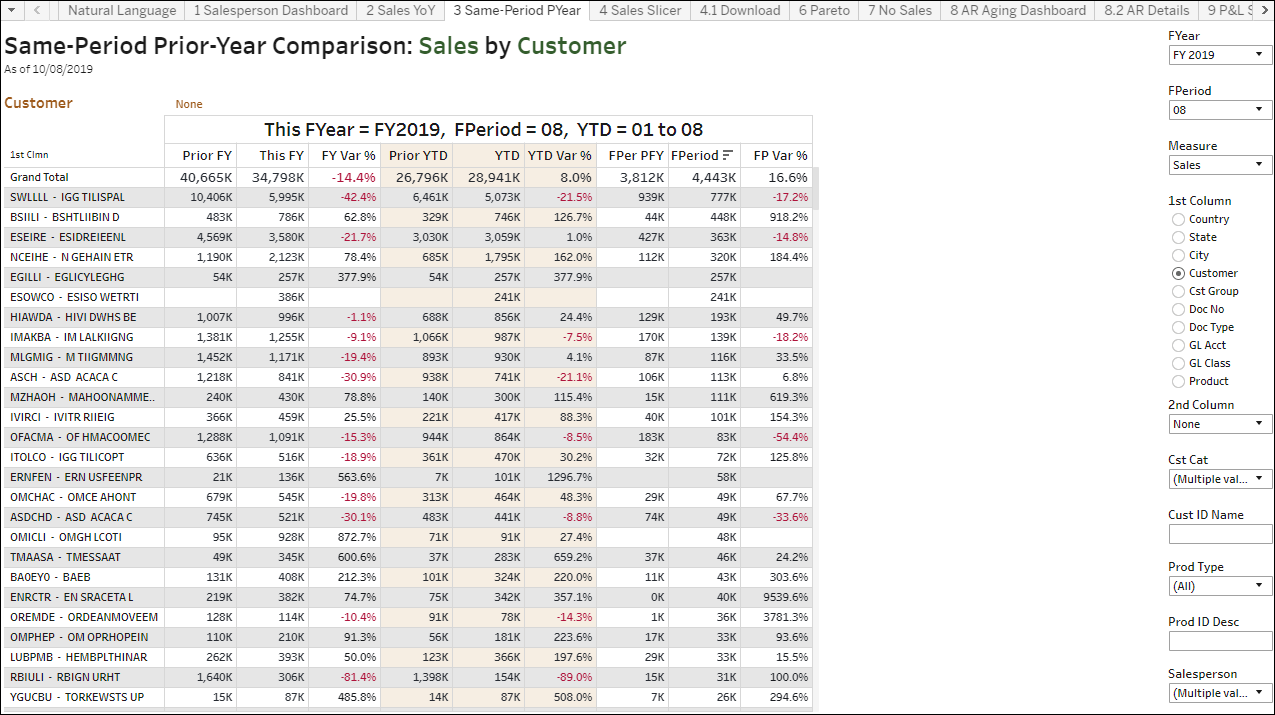
Same-Period Prior-Year Comparison (also in Advanced Analytics)
Choose a year and period, and easily analyze how the period, YTD, and full year compare to the prior year by different dimensions. Allows easy drill down to further dimensions. Ex.: KPIs by customer and project.
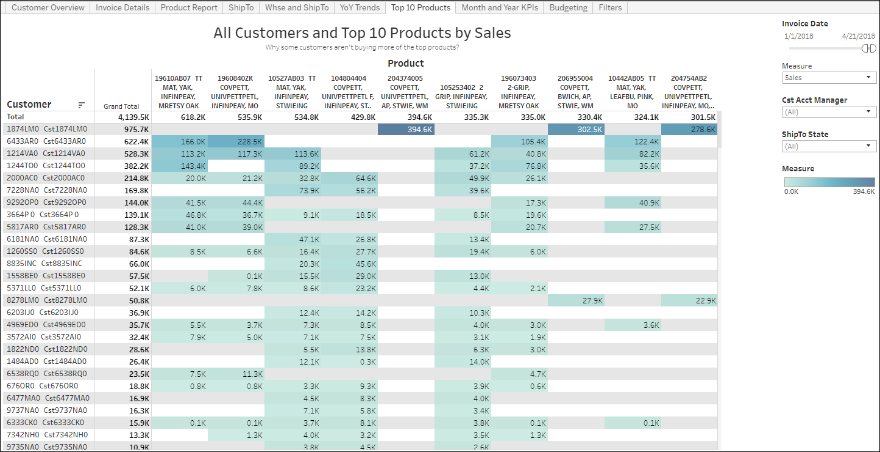
Top Products/Service Sales
Easy access to who’s purchasing your top products/services. Why are some large clients not buying the top products/services?
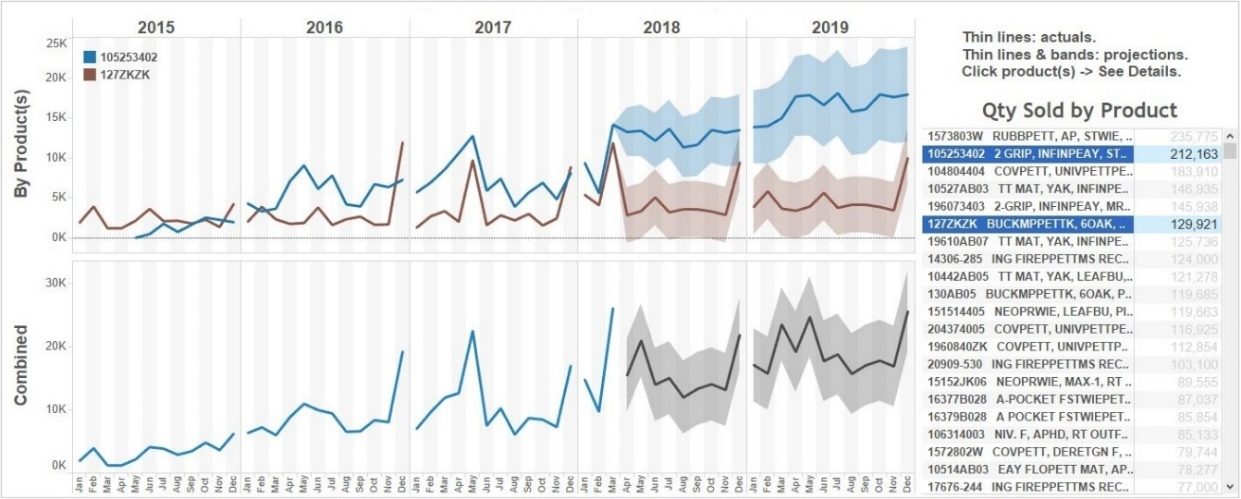
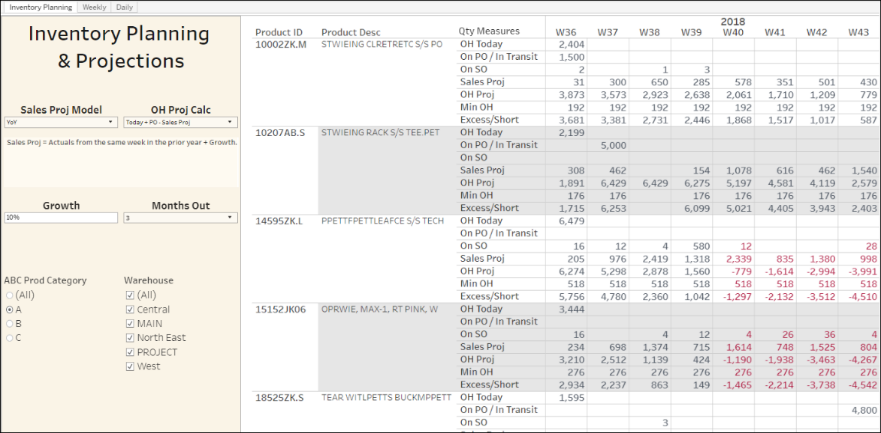
Sales Projection and What-If Scenarios
When working with high volume data such as for sales or inventory projection, DataSelf can leverage tools such as MS SQL Server, Tableau, Power BI and R to allow companies to tackle complex statistical algorithms for forecasting.
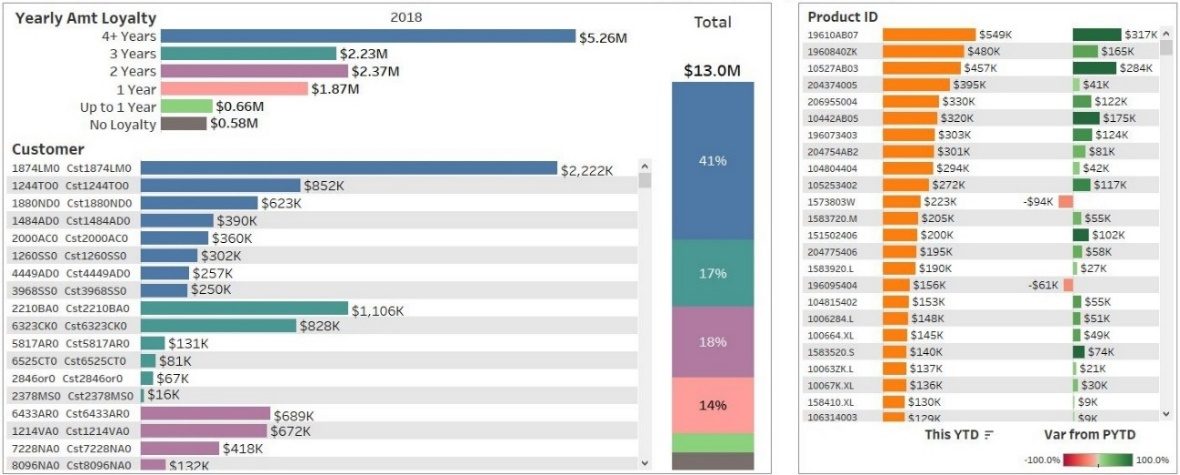
Customer Loyalty
To keep a tab on why clients stick around, and why some leave.
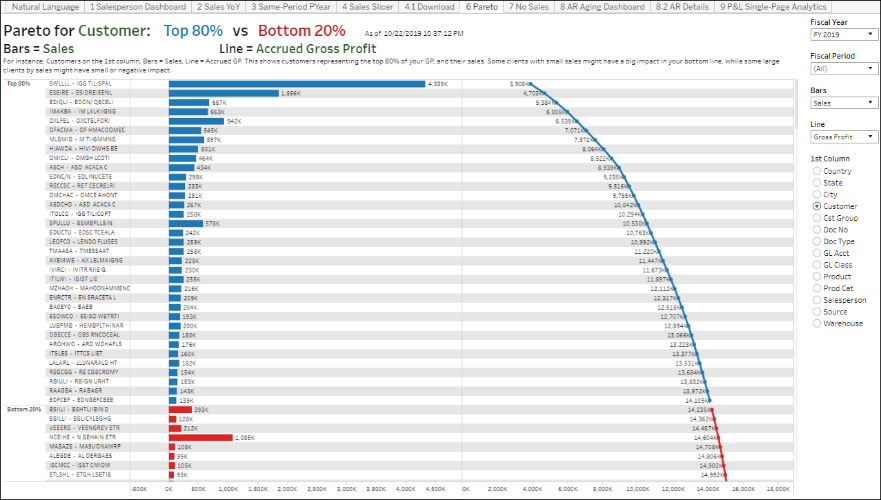
Dual-Measure Pareto (also in Advanced Analytics)
Shows how clients, projects, and other dimensions affect the bottom line. Should you invest more in some of them and discontinue others?
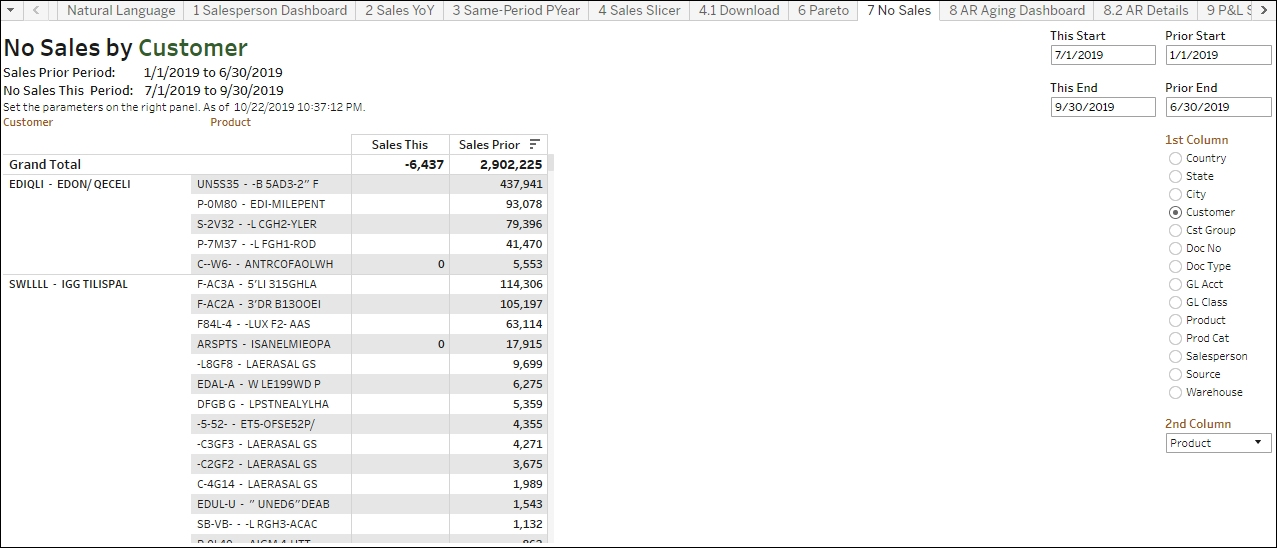
No Sales (also in Advanced Analytics)
Monitoring no new sales quickly can avoid customer friction.
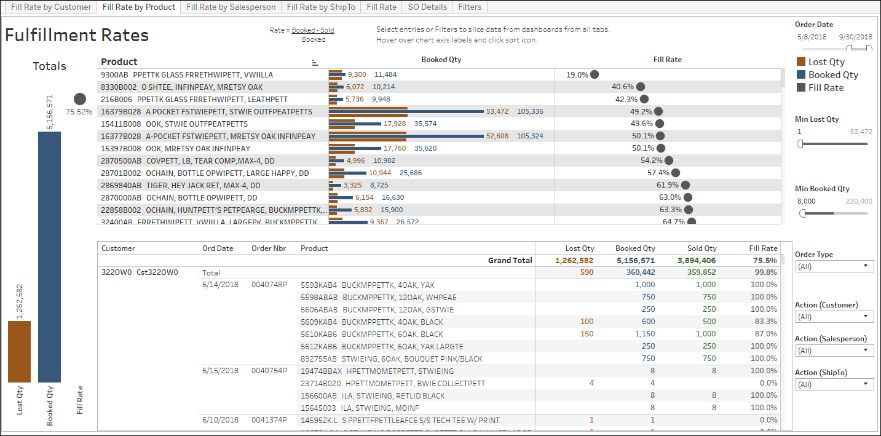
Fulfillment Rates
Closely and timely monitoring fulfillment rates can greatly impact the management of customer satisfaction, business efficiency and lost revenues.
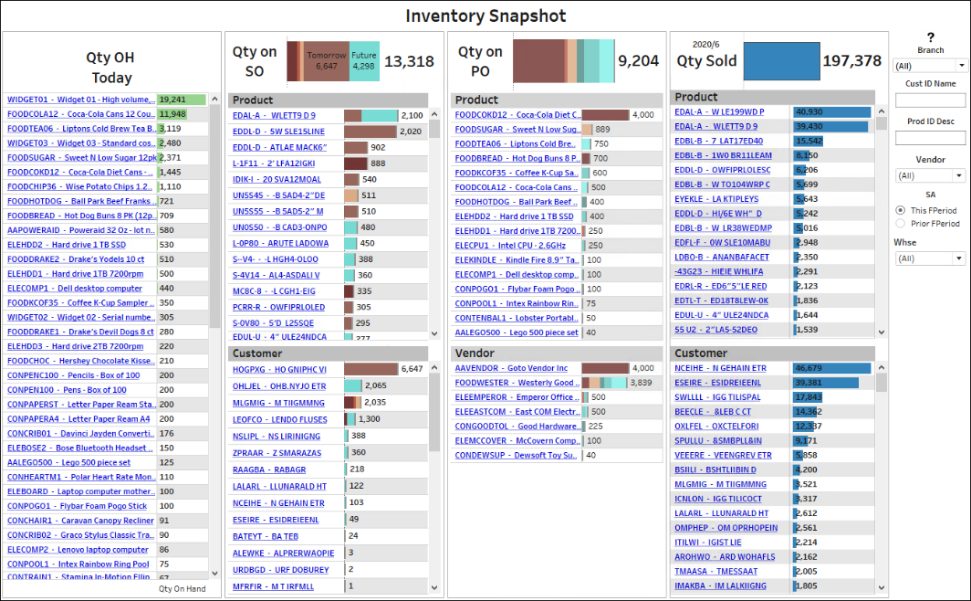
Inventory Snapshot (also in Advanced Analytics)
Easy and interactive analysis of your inventory On Hand today, Open SOs, Open Pos and Sold.
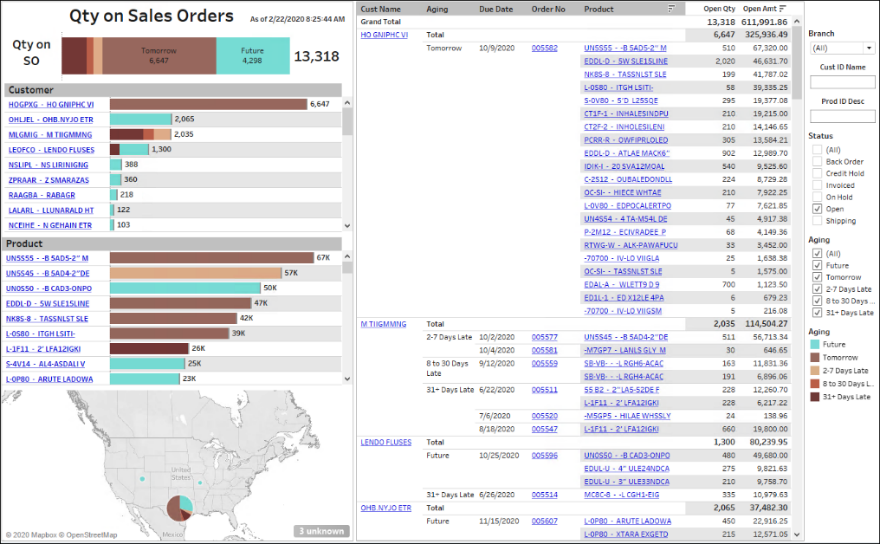
Open Sales Orders (also in Advanced Analytics)
Extensive analysis of your Sales Orders.
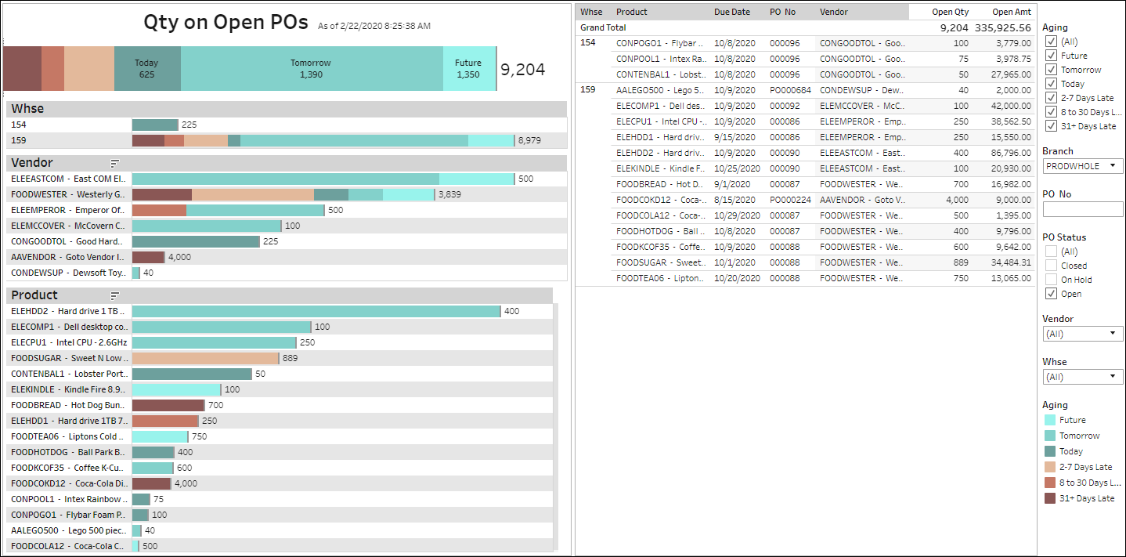
Open Purchase Orders (also in Advanced Analytics)
Extensive analysis of your Purchase Orders.
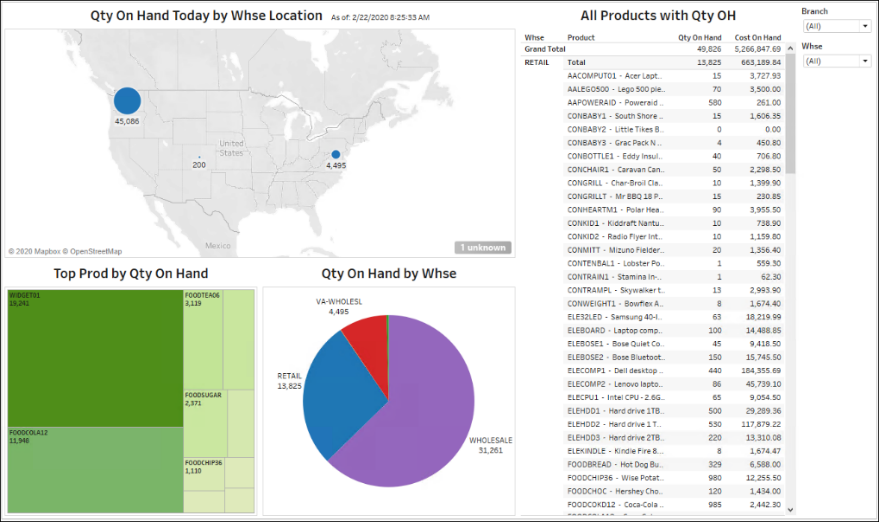
Inventory On Hand Today (also in Advanced Analytics)
Extensive analysis of your On Hand Today.
Days of Stock and Inventory Projection
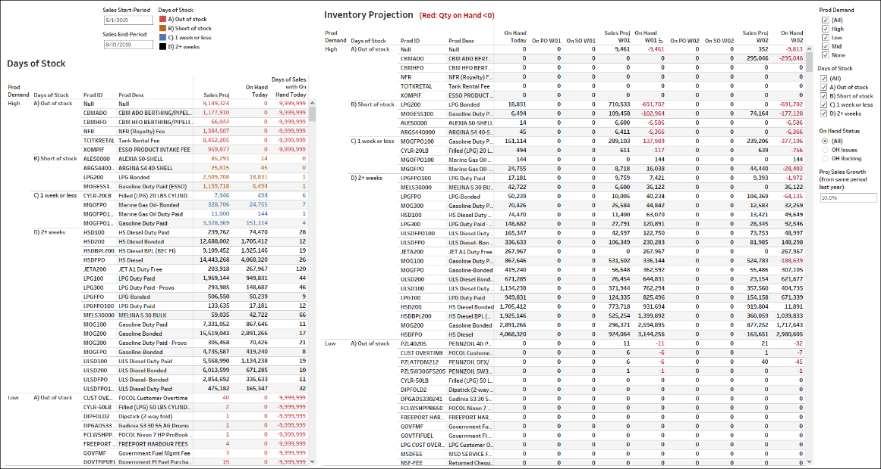
Inventory Planning and Projections
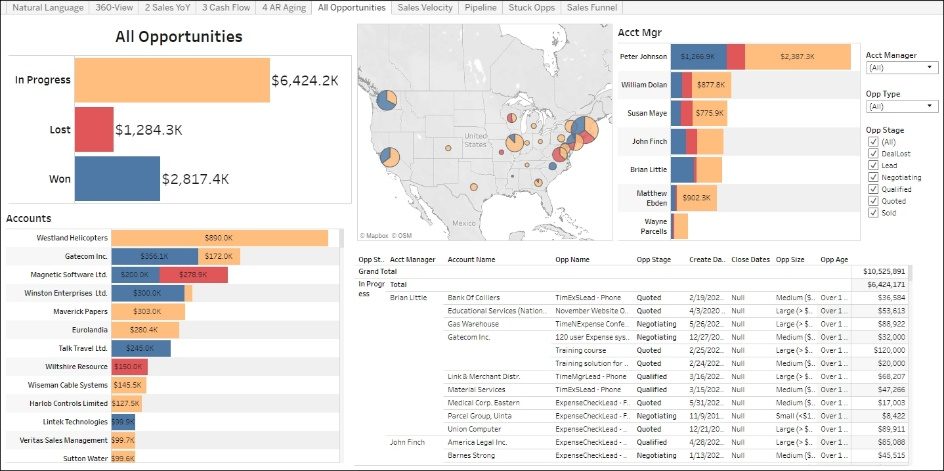
Opportunities
Slice and dice your opportunities by different dimensions.
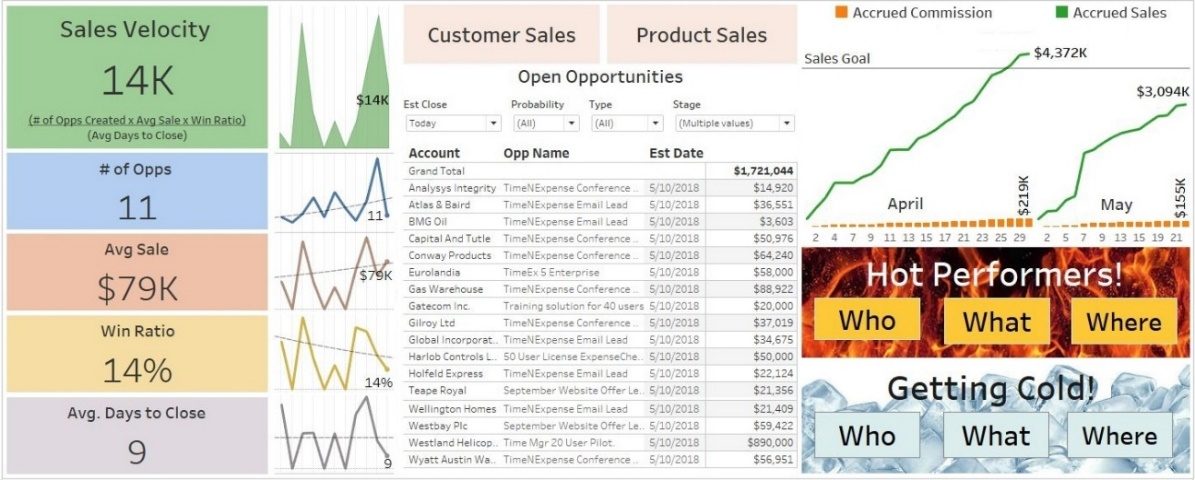
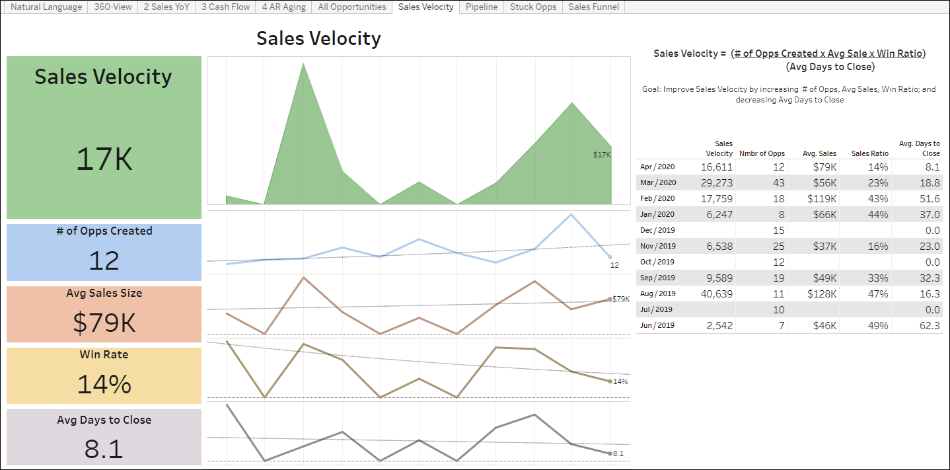
Sales Velocity
A powerful method to analyze the efficiency of your sales processes and team.
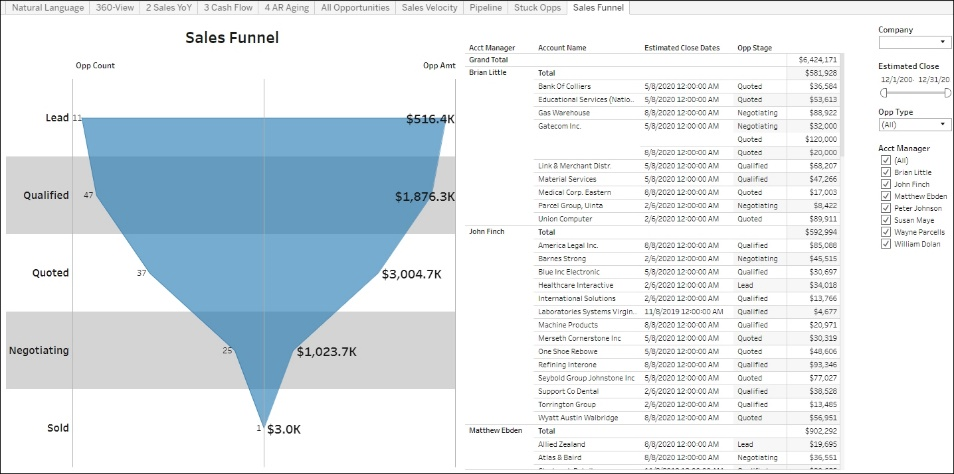
Sales Funnel
Easy and interactive ways to slice and dice your sales funnel.
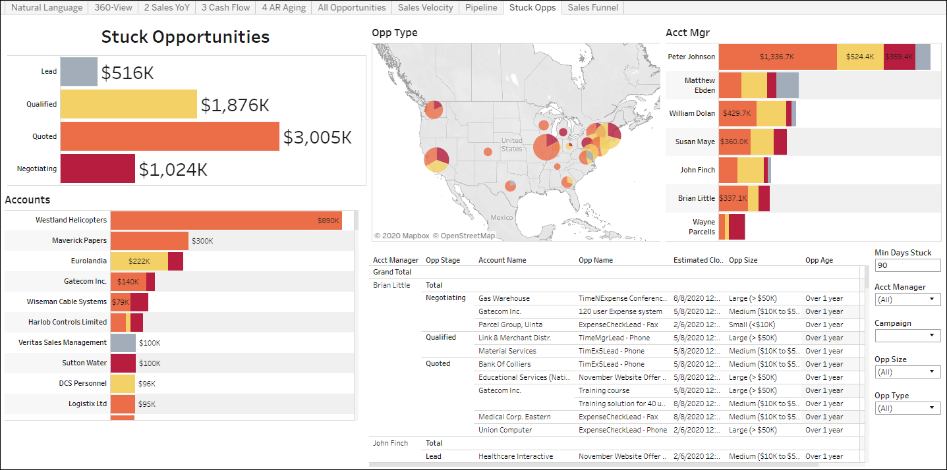
Stuck Opportunities
Many stuck opportunities need work to move forward, otherwise they will be gone. Be on top of them, easily.
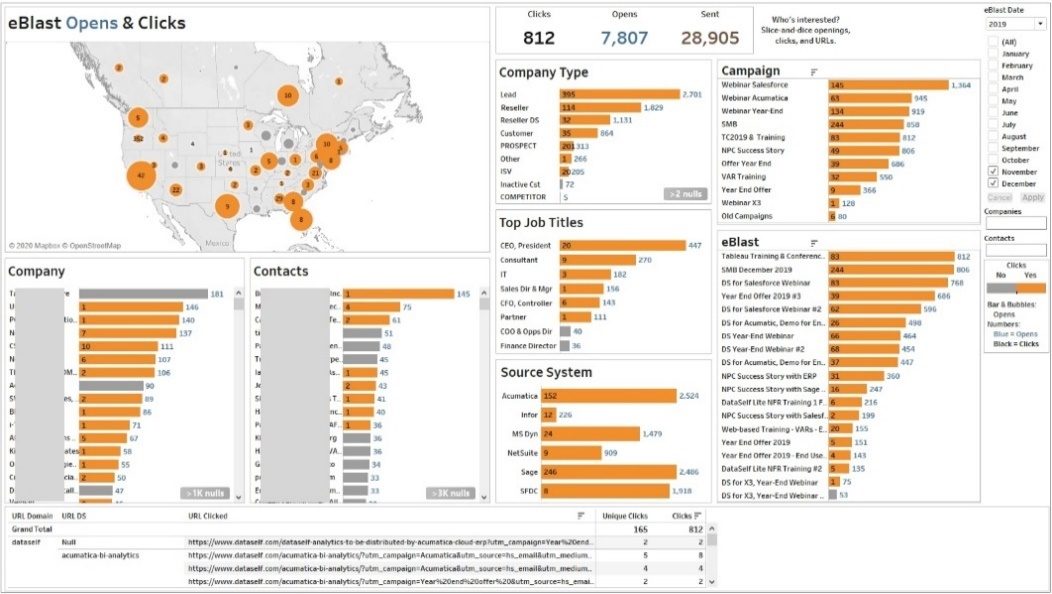
Open & Click KPIs
Easy and interactive ways to analyze which companies and individuals have been consuming your eBlasts across campaigns and time.
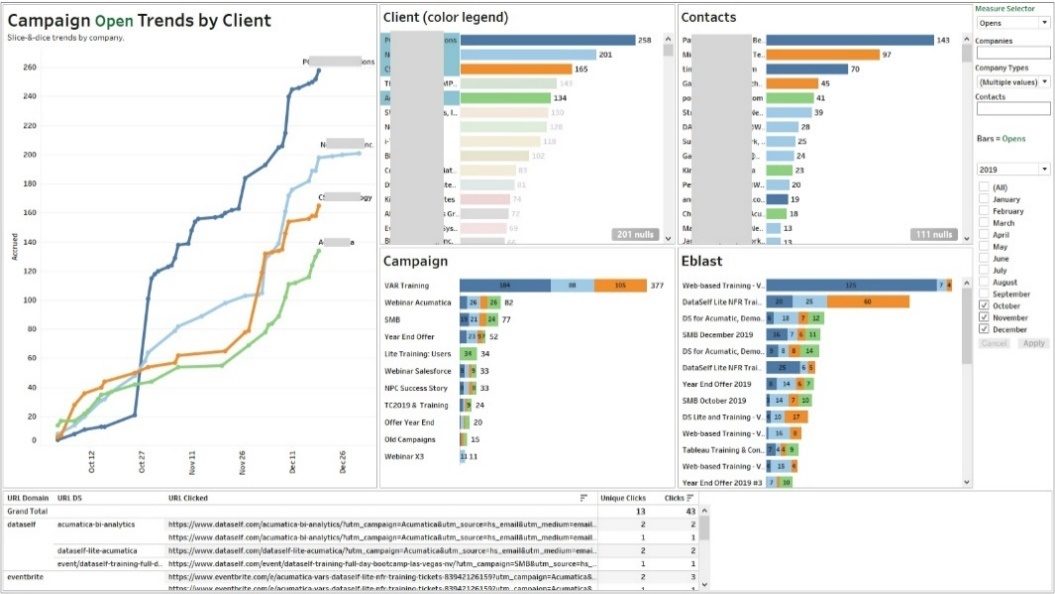
Open & Click Trends and KPIs by Client
Easy and interactive way to analyze trends from companies and individuals consuming your eBlasts across campaigns.
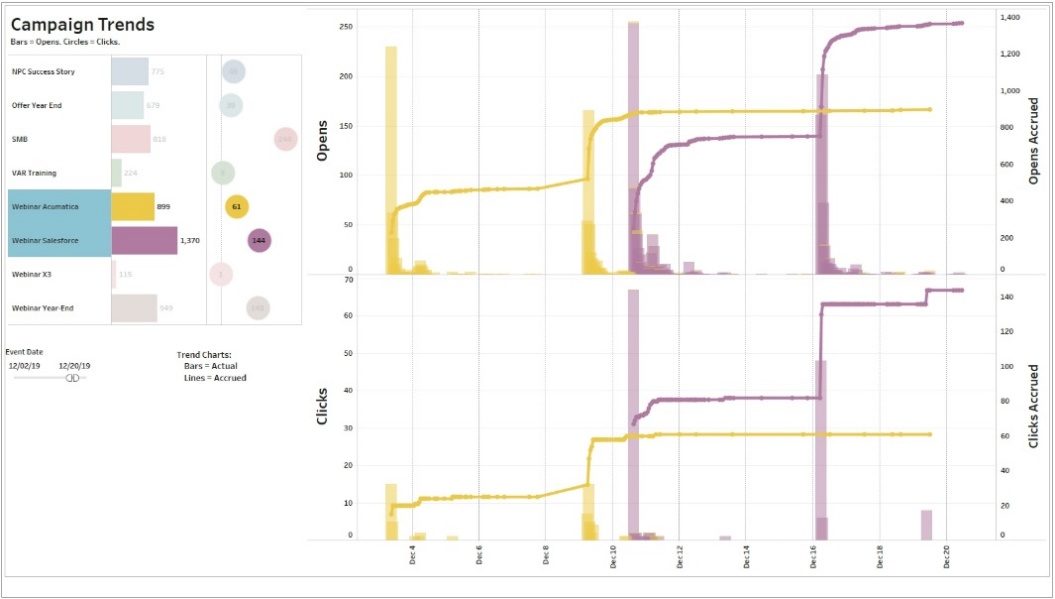
Open & Click Trends Across Campaigns
Interactive ways to analyze how opens and clicks perform across campaigns and time.
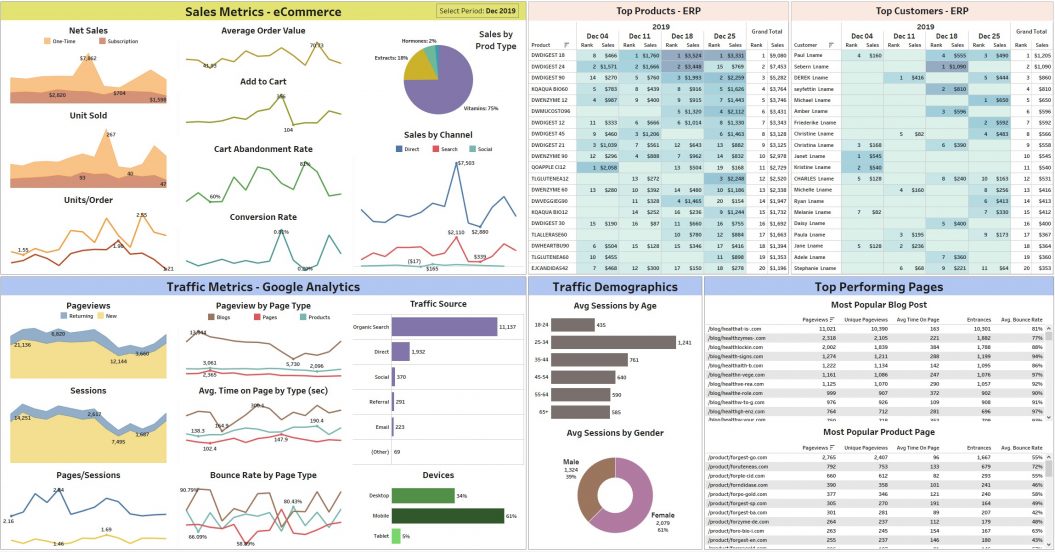
Google Analytics and E-Commerce – Optional
These templates have a wide range of configuration possibilities to adapt to unique business needs. Actual templates might vary. Some might require additional configuration not included in the SOW.
You can find a more complete full list of DataSelf templates at https://www.dataself.com/templates-2/.
Contact our Construction BI Experts!
Fill out the following form and one of our construction analytics experts will contact you shortly.