Days of Stock Report: Business Insights Provided
 Focus: Fulfillment, just-in-time inventory, stock outages & overstocks
Managing inventory to reduce your chance of stock shortages – while also not keeping an excessive quantity on-hand – is a balancing act that every company with a standing inventory struggles to achieve. Predictions based on historical consumption and replenishment are the best way to attain this goal.
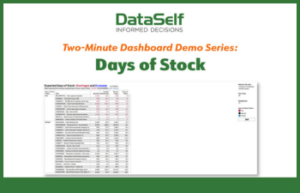
The Days of Stock report does exactly that; it uses the history of item sales and purchase orders to forecast likely future needs. Adopting a color-coding scheme, it identifies items facing a probable shortage in the near future, items whose on-hand quantity is sufficient to address future needs, and items clearly in an overstock status.
The top business insights provided by this report include:
- Which items you need to urgently re-order to avoid stock outages
- Which items are currently overstocked
- Which items are in jeopardy of being written off due to spoilage or lot expiration.
- Which items are selling best (& worst) during certain times of the year.
- How many days until you are unable to fulfill orders for specific items
- Which salesreps are best at selling specific items, which are worst, and how they can help each other
- What type (or ‘class’) of items have sold the most quantity over the last ‘x’ months or years
- Which items need to be promoted or discounted to reduce their on-hand qty
The report includes the following components:
KPIs: quantity sold, avg qty sold per day, qty on-hand, days of stock
Totaled by: item, salesperson
Selectable by: date, item class, salesperson
Timeframe: user-definable
Special: projected ‘days of stock’ per item; items grouped by ‘hot’ (insufficient on-hand), ‘normal’ (sufficient on-hand), and ‘frozen’ (in overstock)
View the Days of Stock dashboard in action here (in just 2-minutes!)
…And this is just one of the many fully customizable inventory management reports DataSelf delivers – ready to use right out of the box.