The SMB Analytics Wire – June 2026
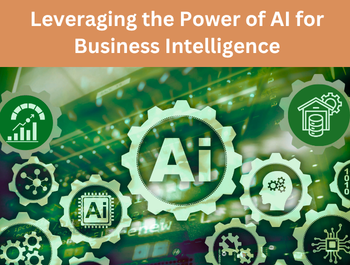
Data Visualization and AI in Business Intelligence
The Lines are Beginning to Blur – Here’s What You Need to Know
 “What’s the difference between a data visualization tool and an AI tool?”
It’s a simple question – but the answer isn’t so simple anymore. Unfortunately, it’s not a simple answer, as the dividing lines between the two are starting to blur – particularly on the AI side of things.
Here’s where that’s heading, where each one still falls short, and why your data is fundamentally important to the bottom line.
Business Intelligence: The Next Generation of BI Solutions
 Most organizations can access their data. Few can trust it.
The real BI challenge isn’t access – it’s building a foundation that delivers consistent, reliable insight across systems, teams, and tools.
Why BI Falls Short
- Manual modeling. Siloed systems. Inconsistent metrics.
- Unpredictable costs.
- No single version of the truth. Sound familiar?
Next-Generation BI Changes This
- Decoupled Architecture – Processing, modeling, and visualization work independently for flexibility and scale.
- Semantic Consistency – Shared definitions mean every team works from the same trusted data.
- AI-Assisted Automation – Faster modeling, less manual effort, governance intact.
The Result: Faster insights. Better accuracy. Higher adoption. Analytics that scale.
Industry Insight for Acumatica
 Acumatica is Your Foundation. DataSelf’s Industry-Focused KPIs Take You Further
Acumatica captures an enormous amount of financial and operational data – but turning that data into the right KPIs for management is the real challenge.
DataSelf offers a curated layer of industry-focused KPIs on top of your existing Acumatica data, so teams get meaningful analytics tailored to how their industry actually operates – no custom reports required.
Algorithm Helps Clients with Next Generation Analytics and Data Warehousing
![]() With the need for decision support tools outpacing traditional reporting technologies, Algorithm Inc. and DataSelf Corp., the mid-market leader in analytics and data warehousing software, have joined forces to provide comprehensive Business Intelligence solutions.
With the need for decision support tools outpacing traditional reporting technologies, Algorithm Inc. and DataSelf Corp., the mid-market leader in analytics and data warehousing software, have joined forces to provide comprehensive Business Intelligence solutions.
Addressing the trend where built-in ERP reporting and Excel spreadsheets are insufficient to support deeper analysis and forecasting, the partnership enables Algorithm, Inc. to deliver powerful data management and decision support systems that improve how companies measure performance, generate accurate forecasts and make more trustworthy plans for the future.
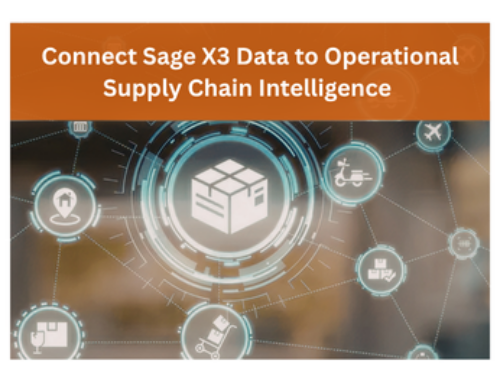
Connect Sage X3 Data to Operational Supply Chain Intelligence
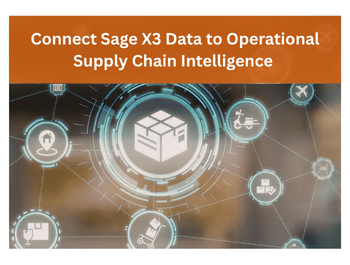 Sage X3 is built for organizations managing complex operational environments – manufacturing, distribution, and global supply chains – each of which generate enormous amounts of data across production, inventory, logistics, and finance. The challenge is not data availability – it’s making that data meaningful.
Useful Data Lives Across a Business
In Sage X3, critical information is distributed across:
- Production systems
- Inventory and warehouse operations
- Procurement and supplier activity
- Financial and cost structures
- And more
Each area tells part of the story – but rarely does a full picture emerge.
Enhance Sage ERP with Industry-Specific Analytics
 When it’s time to upgrade your Sage ERP reporting, today’s Business Intelligence technology offers more power than ever before.
- KPIs specific to your industry
- Role-specific metrics
- AI-driven insights
These innovations transform how organizations access and understand their data, significantly improving both efficiency and productivity.
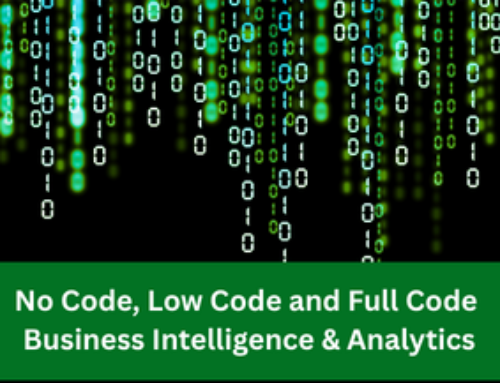
BI Built Your Way: From Drag-and-Drop to Deep Customization
 With no code, low code, and full code capabilities
A modern BI solution should meet you exactly where you are – whether you write zero code or build complex data systems. That’s the promise of no code, low code, and full code: flexibility without compromise.
With a “no code / low code / full code” approach, DataSelf adapts to the various – and changing – technical aptitudes of its user base. Each ‘level’ of coding delivers a balance between technical sophistication, customization, and cost (in both time and money). And now, with embedded AI-assist – non-technical users are better able to leverage coding features which would have once been out of their reach. It makes coding accessible for all.
Dashboard Spotlight: Missed Shipments Measured: Turning Fulfillment Gaps into Actionable Insights
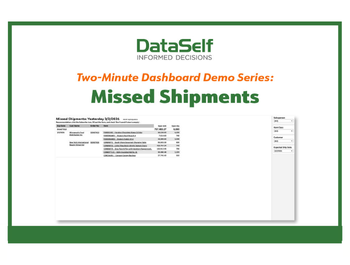 Missed shipments. They’re an unfortunate but unavoidable part of doing business as a distributor. And as important as it is to use processes and technologies that improve the shipping process, it’s equally important to leverage analytics that identifies not only what shipments have been missed, but who’s been affected, the impact on revenue, and whether these missed shipments point at any identifiable trends.
Dashboard Spotlight: Sales Orders Late and Pending
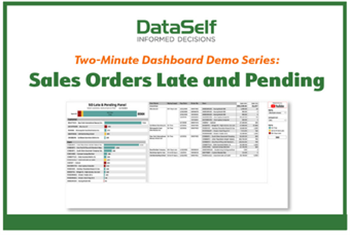 The KPIs Every Operations Team Needs
Exceptions and anomalies. Problems like occasional late shipments will almost always be a fact of life for businesses that have product to ship. And while there is no surefire way to prevent such delays, you can prepare yourself for such situations by the timely knowledge of such occurrences.
The Sales Orders Late & Pending report provides you with this knowledge.
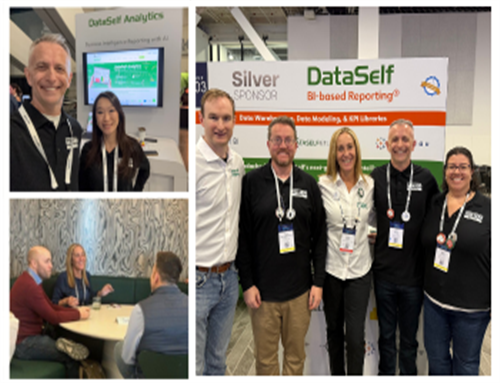
2026 Events, Demos and Webinars
 One of our favorite things is connecting with you! Here’s what we’ve been up to in the last quarter.
Recordings & Resources
- Data Visualization and AI in Business Intelligence
- Business Intelligence: The Next Generation of BI Solutions
- Industry Insight for Acumatica
- Algorithm Helps Clients with Next Generation Analytics and Data Warehousing
- Connect Sage X3 Data to Operational Supply Chain Intelligence
- Enhance Sage ERP with Industry-Specific Analytics
- BI Built Your Way: From Drag-and-Drop to Deep Customization
- Dashboard Spotlight: Missed Shipments Measured
- Dashboard Spotlight: Sales Orders Late and Pending
- 2026 Events, Demos and Webinars!