The SMB Analytics Wire – June 2025
How Business Intelligence-based Analytics Help You Navigate an Uncertain Economy
 Part I: Effective Inventory Management
Being able to make informed decisions is more important than ever – and business intelligence-based analytics have the unique ability to use a business’ past and current activities to predict future business behavior – as well as reveal to an organization what steps to take in response.
Data Warehousing Decoded: Building a Smarter Analytics Foundation
![]() Part 1: What Is a Data Warehouse, and Why Does It Matter for Modern Analytics?
Part 1: What Is a Data Warehouse, and Why Does It Matter for Modern Analytics?
In today’s data-driven world, businesses have more information at their fingertips than ever before – but turning that data into actionable insight is still a challenge.
One critical component often overlooked in the analytics process is the data warehouse. While reporting tools like Power BI and Tableau get most of the attention, they rely heavily on the quality and structure of the data they consume. This is where a data warehouse becomes invaluable, because…
“. . . the analytics you get out of a system depends on the data you put in it.”
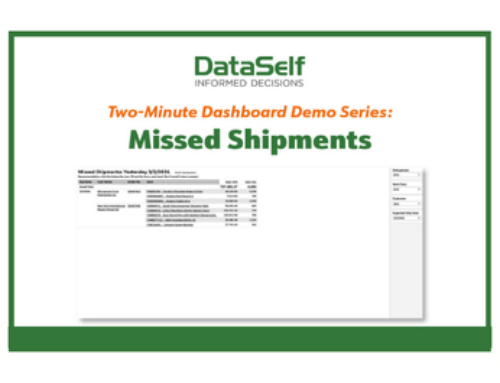
Dashboard Spotlight:
 Cashflow Projection
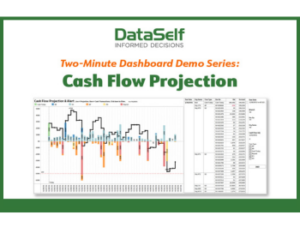
The Cash Flow Projection report is one of the favorite dashboards – if not the favorite – of CFOs and their accounting teams. With just a glance, users can see upcoming expenses and revenues, as well as a chronological projection of their available cash.
Whether it’s to identify excess available cash, from which purchases and other investments can be made, or to anticipate (and prepare for) cash shortages – such as tapping into an organization’s line-of-credit, this report helps to eliminate financial ‘surprises’ – both good and bad.
View the top 10 benefits of the Cashflow Projection Dashboard here >>
 Interactive P&L
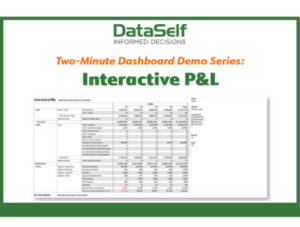
There are three keys to an insightful P&L report:
- Drill-down
- Roll-up
- And slice and dice
With these tools, users can just as easily sub-total and total the income and expenses from any given category (such as operating expenses) as they can drill-down into the transactional details that make up that segment.
View the top business insights provided by DataSelf’s P&L Report >>
 Year Over Year Variances
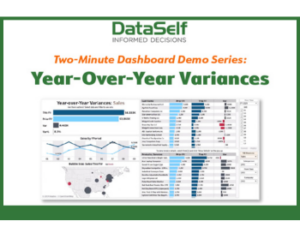
The Year-Over-Year Variances report compares sales totals between periods (e.g., months) within a selected fiscal year and the same periods in a previous year and calculates the corresponding variances in dollars and as a percentage.
Use the YOY report to identify:
- The effect of seasonality on your sales performance.
- Whether you’re doing better or worse this year versus last.
- Whether you’re meeting your sales growth goals for this year.
- Which periods are performing better (or worse) this year versus last.
Supercharging Sage X3 Reporting: Faster Insights, Easier Dashboards, Smarter Decisions
 Sage X3 incorporates good reporting features that are designed to meet many needs of a typical user. There are, however, limitations to its capabilities, and it’s important to know when and where you need to look beyond X3’s native reporting capabilities. This is especially true in areas such as ease of use, advanced analytics, and data blending.
DataSelf Analytics supercharges Sage X3 reporting to improve the following areas:
1. Report runtime.
2. Report customization.
3. Instant access to KPIs.
4. Ease of Use
5. Single Version of the Truth
6. Integration & Data Blending
7. Advanced Analytics
8. Automated Distribution & Alerts
Press Release: DataSelf Releases ‘Dimension, Fact & Time’ Module to Expedite Reporting
 Historically, dimension, fact, and time modeling has been a complex, time-consuming, manual procedure that optimizes application (and other) data for reporting and analytics. With DataSelf DFT, processes such as schema definition, mapping, data review, and analytics configuration are reduced from days to hours – with a corresponding reduction in implementation cost.
2025 Events, Demos and Webinars
 We love getting to meet up with clients and businesses at conferences, webinars and everywhere in between! It is more important than ever that executives and managers have access to clean data and accurate reporting to make better, easier, and faster decisions!
Recordings & Resources
- How BI-based Analytics can Help You Navigate an Uncertain Economy
- Data Warehousing Decoded: What is a Data Warehouse and Why Does it Matter for Modern Analytics?
- Dashboard Spotlight: Cashflow Projection
- Dashboard Spotlight: Interactive P&L
- Dashboard Spotlight: YOY Variances
- Supercharging Sage X3 Reporting: Faster Insights, Easier Dashboards, Smarter Decisions
- Press Release: DataSelf Releases Dimension, Fact & Time Module to Expedite Reporting
- 2025 Events, Demos and Webinars! Quarter 2 Update