Dashboard Spotlight: Interactive Profit and Loss Report
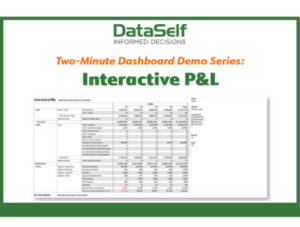 Focus: Profit and Loss Drill-Down, Roll Up, and Slice-and-Dice
A profit-and-loss (or “P&L”) report is one of the most standard tools utilized by a CFO and accounting staff. With financial details from every aspect of a business – whether it’s sales, cost-of-goods-sold, operating expenses, or elsewhere, a P&L dashboard is truly the key to an organization’s finances. However, the sheer quantity of data present in a P&L can also make it one of the most daunting reports from which to get meaningful insight.
There are three keys to an insightful P&L report; they are drill-down, roll-up, and slice and dice. With these tools, users can just as easily sub-total and total the income and expenses from any given category (such as operating expenses) as they can drill-down into the transactional details that make up that segment.
Business insights provided by the Profit and Loss Report
- Month-by-month breakdown of income & expenses
- Aggregate totals for selected segments (such as operating expenses)
- Multi-tier drilldown, such as into ‘advertising’ operating expenses
- Drill-down to show transactional detail
- Slice-and-dice into specific companies/branches/segments
The report includes the following components:
KPIs: income and expense totals
Totaled by: company, branch, multiple segments
Selectable by: company, branch, segment
Timeframe: fiscal year, fiscal month