Dashboard Spotlight: Year Over Year Variances
 Focus: Year-Over-Year Sales Performance Comparison
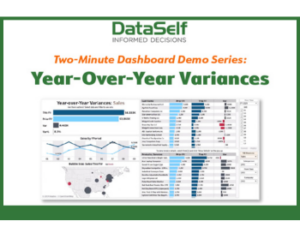
The Year-Over-Year Variances report compares sales totals between periods (e.g., months) within a selected fiscal year and the same periods in a previous year and calculates the corresponding variances in dollars and as a percentage.
The top business insights provided by this year-over-year report include:
- The effect of seasonality on your sales performance
- Whether you’re doing better or worse this year versus last.
- Whether you’re meeting your sales growth goals for this year.
- Which periods are performing better (or worse) this year versus last.
- In which regions your sales are growing (or slowing) this year versus last.
- Which customers are your top-buyers this year versus last.
- Which customers have increased (or decreased) sales this year versus last.
- Which products’ sales have increased (or decreased) this year versus last.
- Which salesreps’ sales have increased or decreased this year versus last.
- Which items (or item classes) are selling better (or worse) this year versus last.
- Whether revenues (or gross profits) per item, customer, or salesrep have grown or declined in periods this year versus last.
- Whether the quantity sold of specific items has grown or declined in periods this year versus last.
The report includes the following components:
KPIs: revenues, gross profit, cost-of-goods sold, quantity sold, variance ($, %)
Totaled by: year, period (e.g., month), region, customer, product Selectable by: salesperson, item class, company
Timeframe: periods this year, periods last year (totaled by year and by period)
Drilldown to: customer invoice detail
Special: geographic mapped distribution