Acumatica Dashboards with Powerful Business Intelligence
We’ve got interactive and insightful Acumatica dashboards for every situation.
![]()
DataSelf Analytics for Acumatica provides dashboard views that are easy to configure to so you see your data your way. From any dashboard, you can go to the underlying Acumatica data with just one click.
Here are just a few of the Acumatica dashboards that are available in DataSelf Analytics Lite and DataSelf Analytics Enterprise.
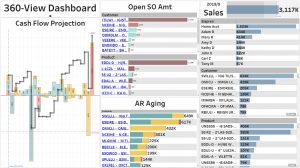
The 360-View Dashboard provides management with a single place to monitor the organization’s main key performance indicators, and easily slice and dice trends to uncover threats and opportunities. From the main page, management can easily drill down into details about their sales, cash flow projection, AR and AP aging. All of this is also available in mobile devices using Android or iOS.
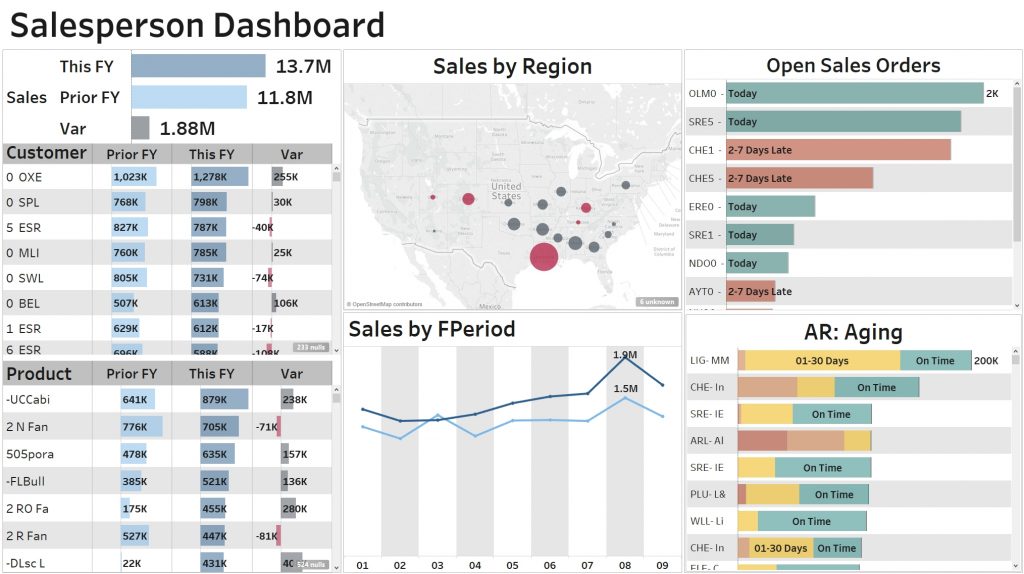
The Salesperson Dashboards lets the sales team analyze trends by customer, product, salesperson, branch, and region. It’s easy to identify and analyze top and bottom performers as well as drill down to details.
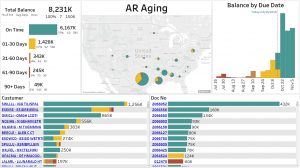
AR Aging Dashboards provides you with simpler and clear visibility into who owes you money, who the acct managers are, trends analysis, where the money is coming from, as well as the ability to interact and drill down to details.
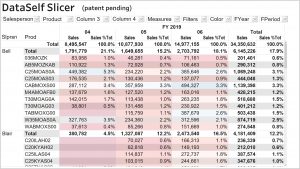
DataSelf Slicer query platform (patent pending) allows any user to slice and dice their data in over a million ways with no training required! You can drill down to details, and variations can easily be saved for future use.
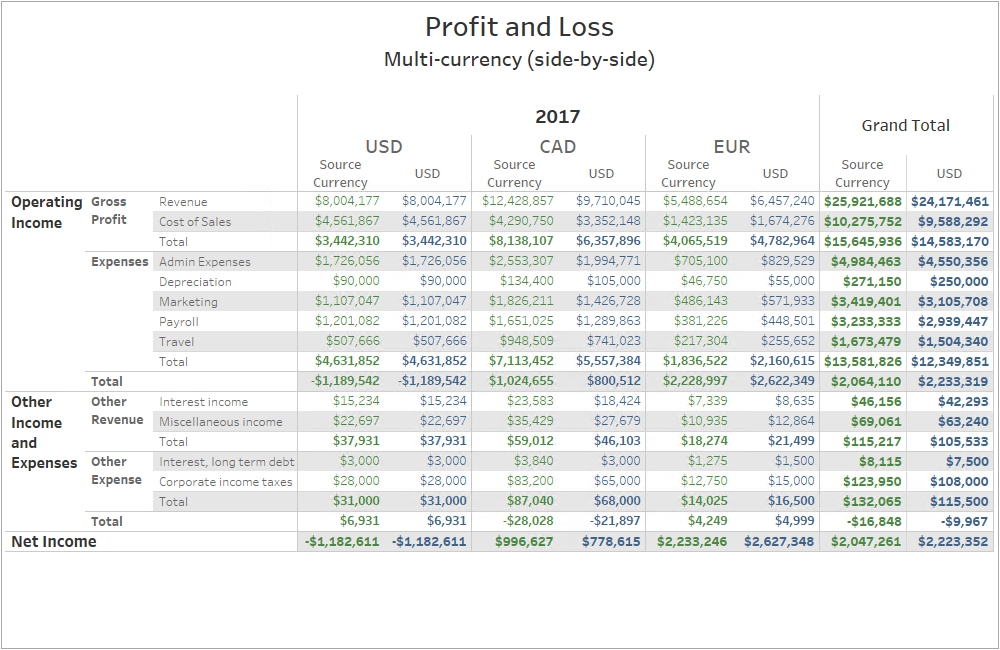
Profit and Loss Multi-Currency Dashboard makes it easy to see financial data in local and USD.
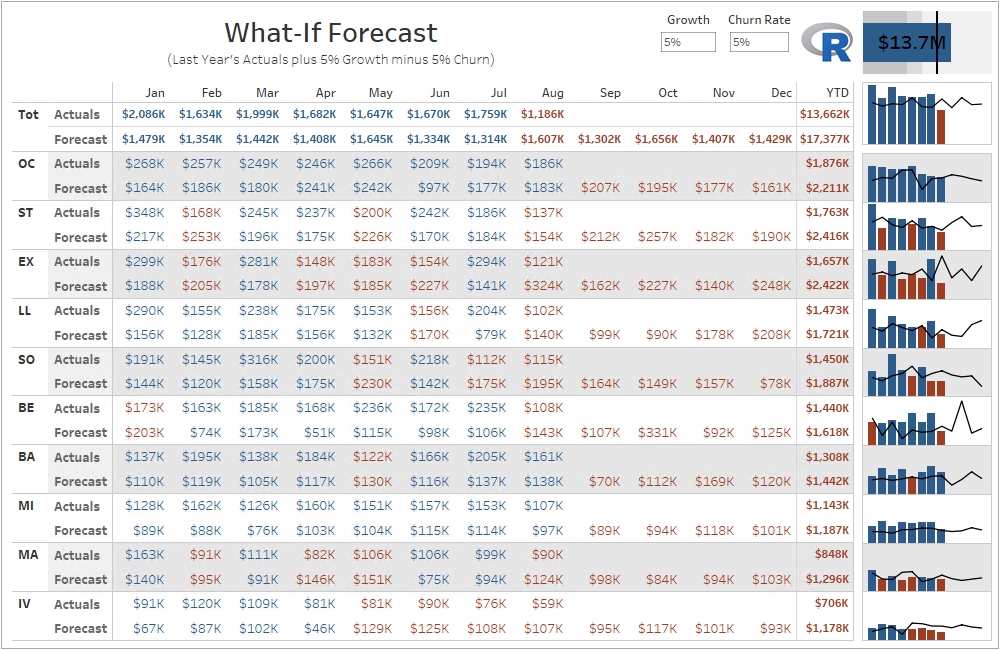
What-If-Forecast Dashboard simplifies planning with comparisons to actuals using different growth and churn rates.
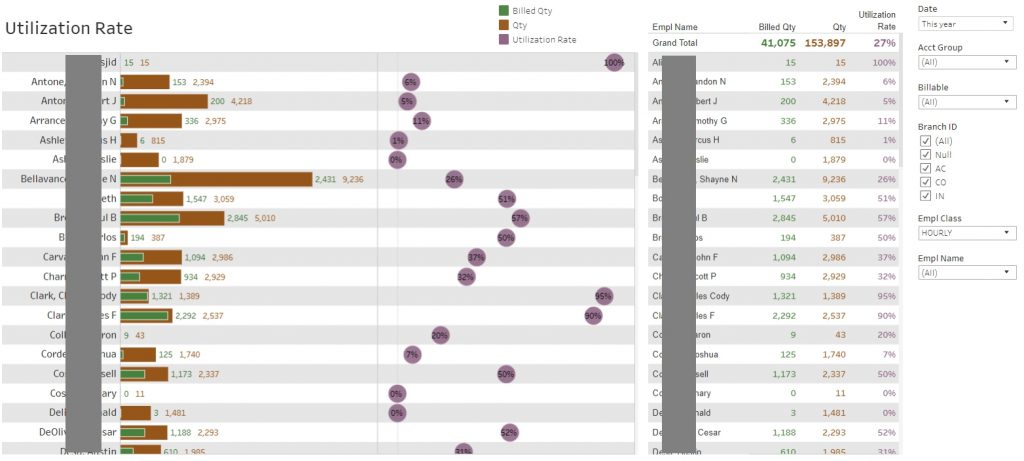
Utilization Rate Dashboard shows an instant view of utilization rate by employee.
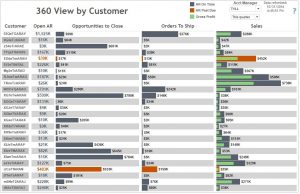
The 360-View by Customer Dashboard is available in DataSelf Analytics Enterprise. It offers detailed data by customer so you can identify top performers and those that are less profitable. For each customer and data set, you can drill down to identify problem areas or trends like outstanding receivables, orders to be shipped, actual sales, gross profit and more.
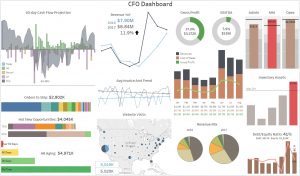
The CFO Dashboard is gives a snapshot 360-degree view of your company’s finances. Cash flow projections, cost of sales, debt/equity ratio–whatever metrics are important to your business can be seen at a glance. Then drill down to learn more.
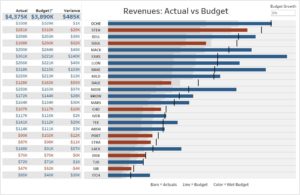
Actual Versus Budget Revenue Dashboard can be configured to cover the specific needs of any organization.
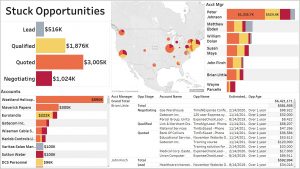
The Stuck Opportunities Dashboard can help you analyze CRM opportunities by account, account manager, campaign, product, status and more.
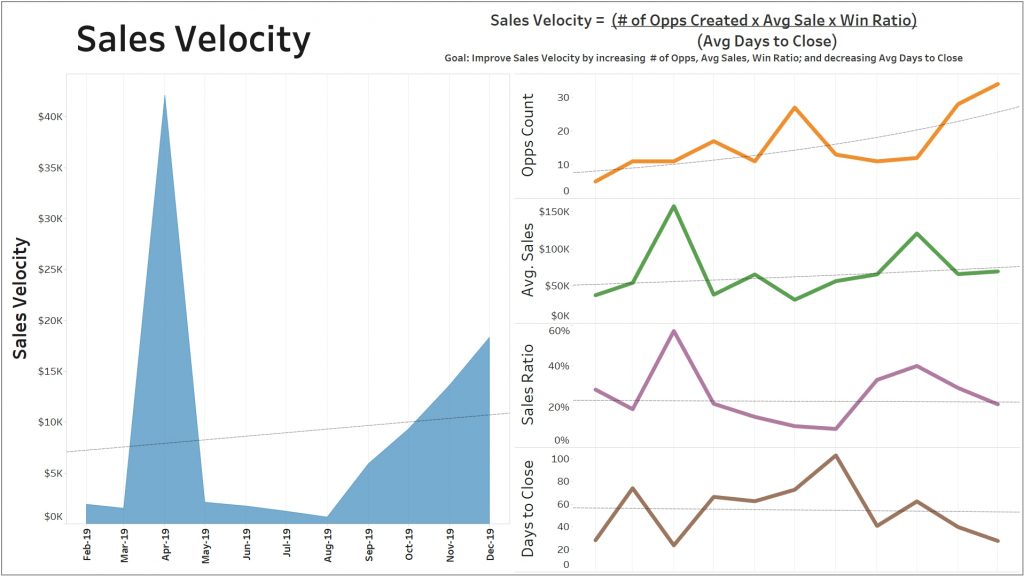
The Sales Velocity Dashboard offers a graphic view of sales opportunities created, average sales, and days to close.
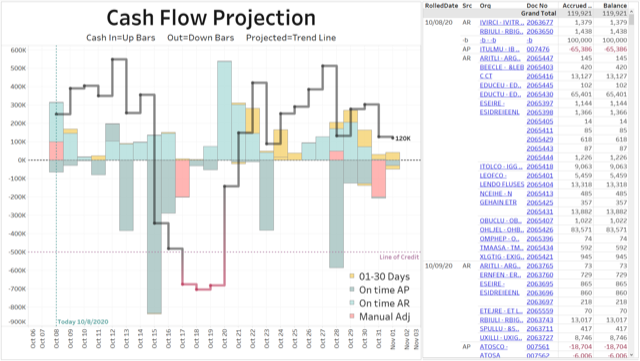
The Cash Flow Projection Dashboard makes it easy to see potential issues with cashflow.
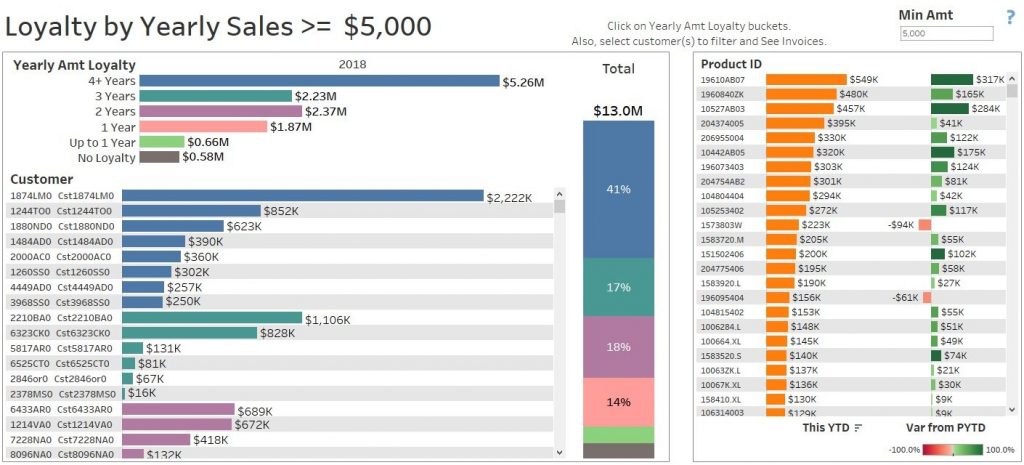
The Customer Loyalty Dashboard helps to identify those customers who have remained loyal over the years and the products that they’ve purchased.
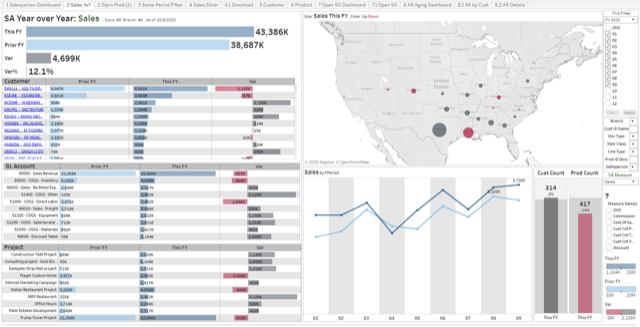
This Sales Dashboard provides a big picture view of year over year sales.
Learn How Easy it is to Customize Your Acumatica Dashboards
Watch this 4-minute video.
DataSelf Analytics Featured at Acumatica Summit 2019 Keynote
Watch the entire keynote presentation here.
Contact our Acumatica BI Experts!
Fill out the following form and one of our cloud analytics experts will contact you shortly.