DataSelf Analytics for HubSpot
Reports, Dashboards, and KPIs (Power BI & Tableau)
CRM: Contact, Opportunity, and Tech Support – Optional
There are 1,000+ templates offering a wide range of configuration possibilities to adapt to unique business needs. Actual templates might vary. Some might require additional configuration not included in SOWs unless specifically described.
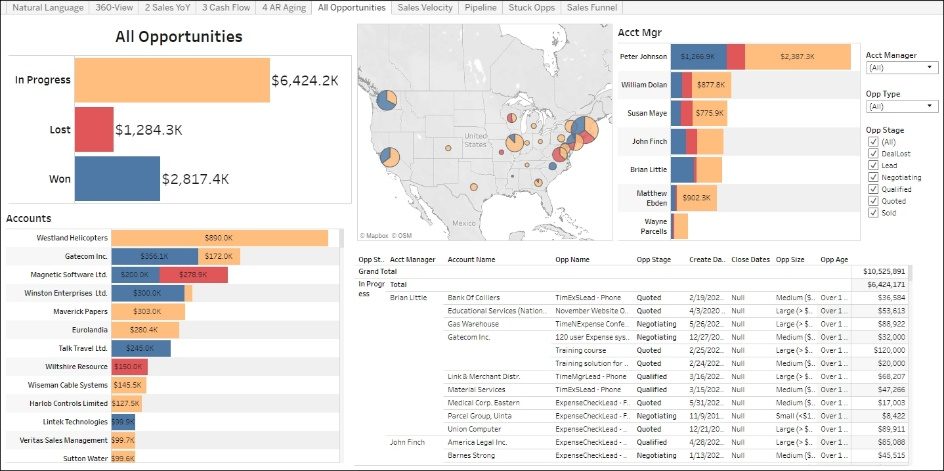
Opportunities
Slice and dice your opportunities by different dimensions.
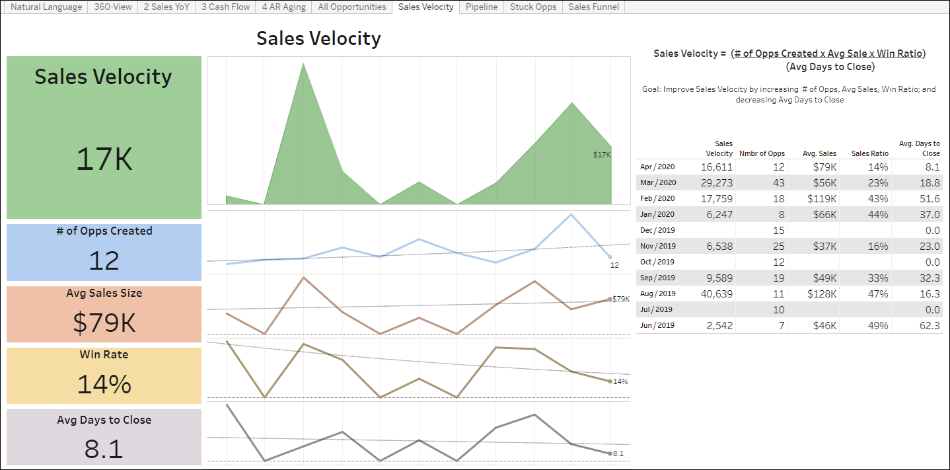
Sales Velocity
A powerful method to analyze the efficiency of your sales processes and team.
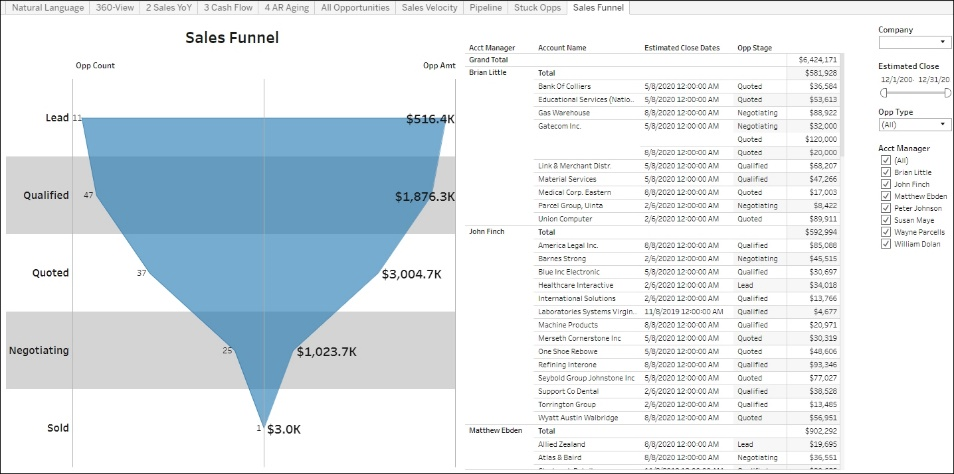
Sales Funnel
Easy and interactive ways to slice and dice your sales funnel.
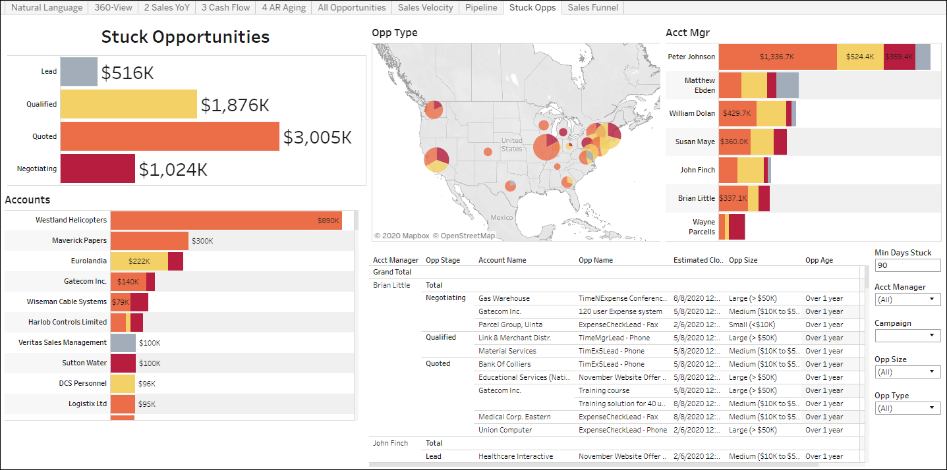
Stuck Opportunities
Many stuck opportunities need work to move forward, otherwise many will be gone. Be on top of them easily.
Marketing Campaigns with User Traction
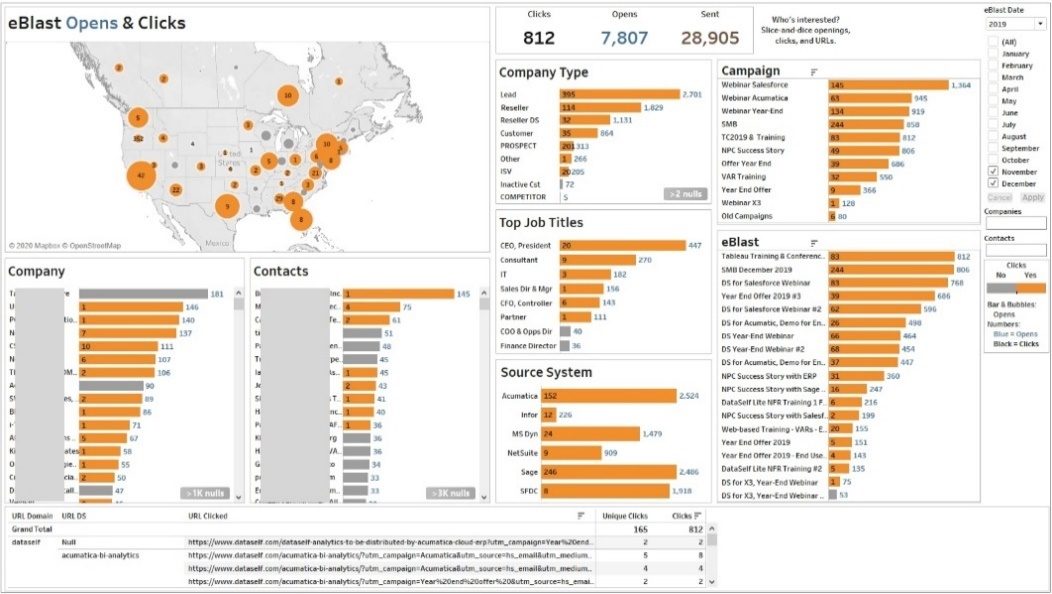
Open & Click KPIs
Easy and interactive ways to analyze which companies and individuals have been consuming your eBlasts across campaigns and time.
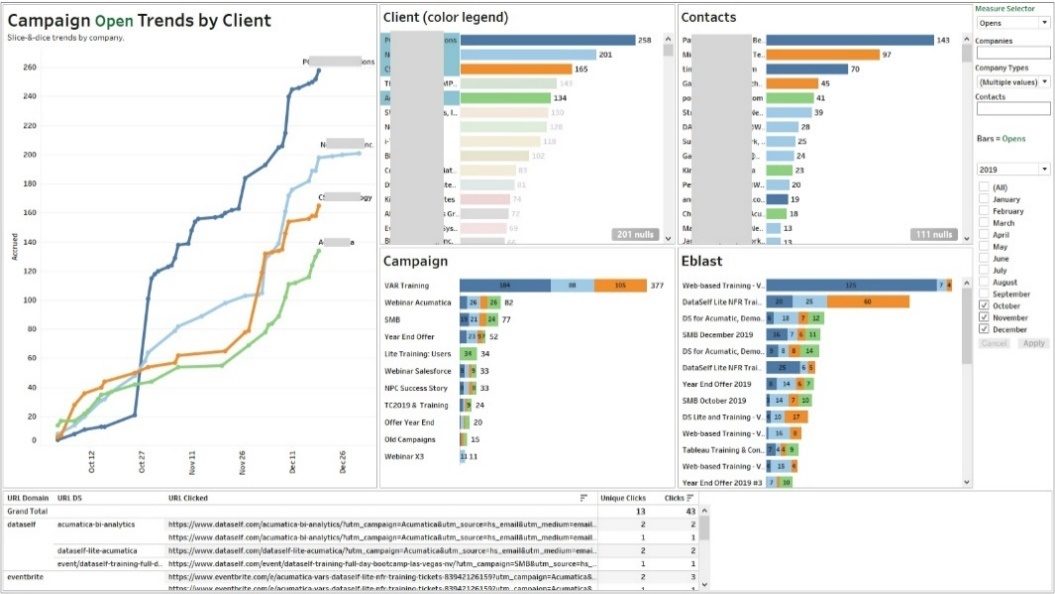
Open & Click Trends and KPIs by Client
Easy and interactive way to analyze trends from companies and individuals consuming your eBlasts across campaigns.
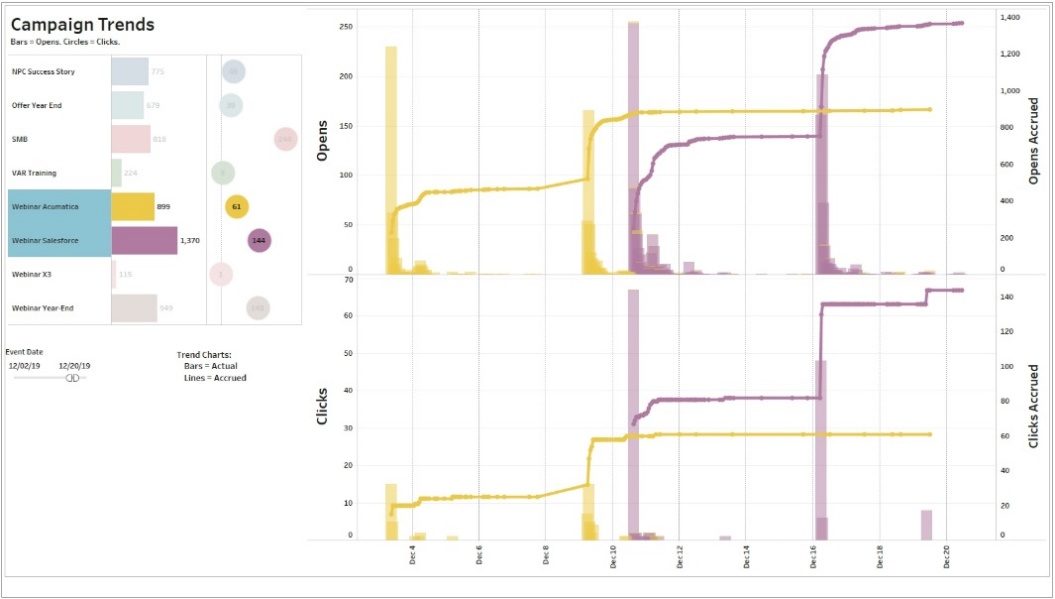
Open & Click Trends Across Campaigns
Interactive ways to analyze how opens and clicks perform across campaigns and time.
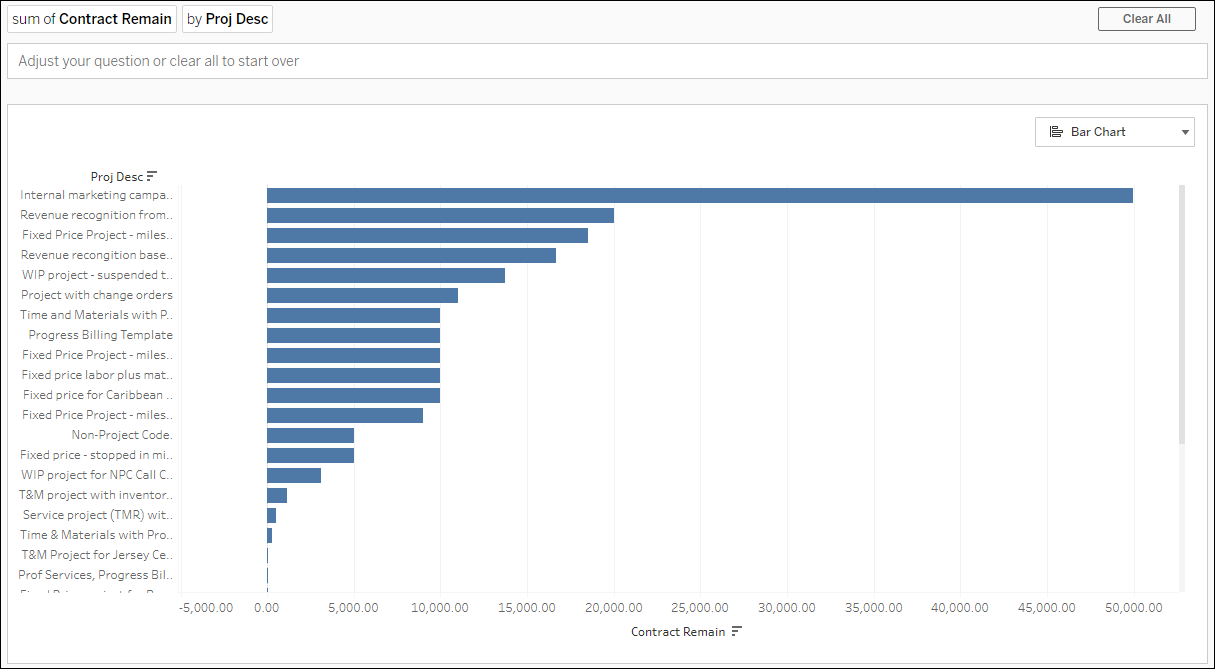
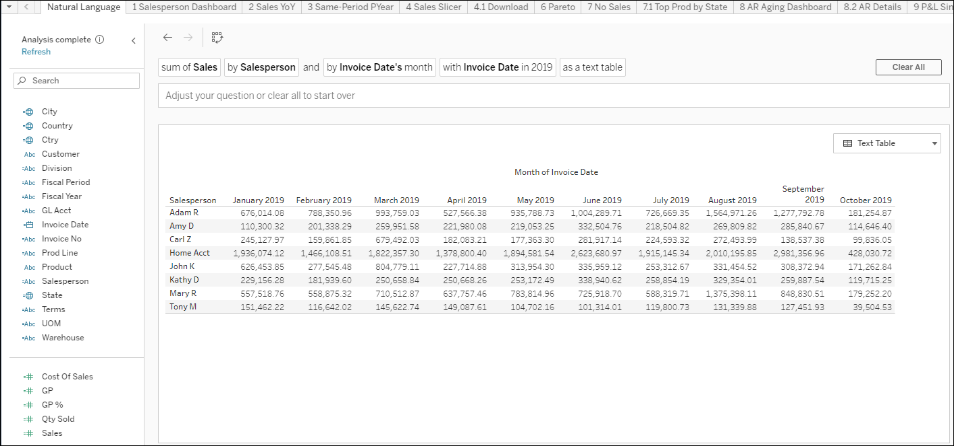
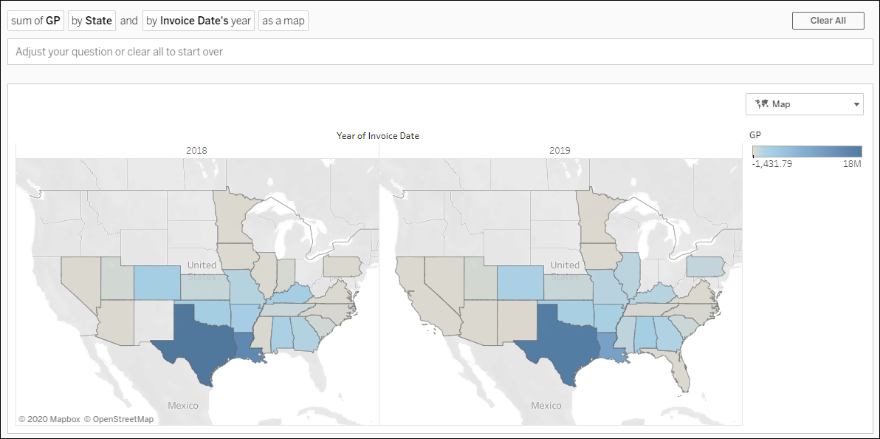
Natural Language Query (NLQ)
Like searching on the internet, type in keywords about your data in DataSelf and an instant and accurate report is created. This is available for each data set in DataSelf and might require additional configuration to meet your company’s needs.
Examples of searches and the report created.
Searching for “Contract Remain Amt by Project” yields:
Searching “Sales by Salesperson by Month in 2019 as a text table” yields:
Searching for “Gross Profit by State by Year as a Map” yields:
Actual dashboards might be slightly different.