Manufacturing Dashboards – Samples
IMPORTANT: Many deployments for Manufacturing require an upgrade to DataSelf Pro or Enterprise Analytics. Consult us for details.
Interactive and insightful manufacturing dashboards for every situation.
Interactive and insightful manufacturing dashboards for every situation.
DataSelf Analytics for Manufacturing provides dashboard views that are easy to configure so you see your data your way. From any dashboard, you can go to the underlying ERP data with just one click.
DataSelf Analytics
Manufacturing Edition
Manufacturing
IMPORTANT: Many deployments for Manufacturing require an upgrade to DataSelf Pro or Enterprise Analytics. Consult us for details.
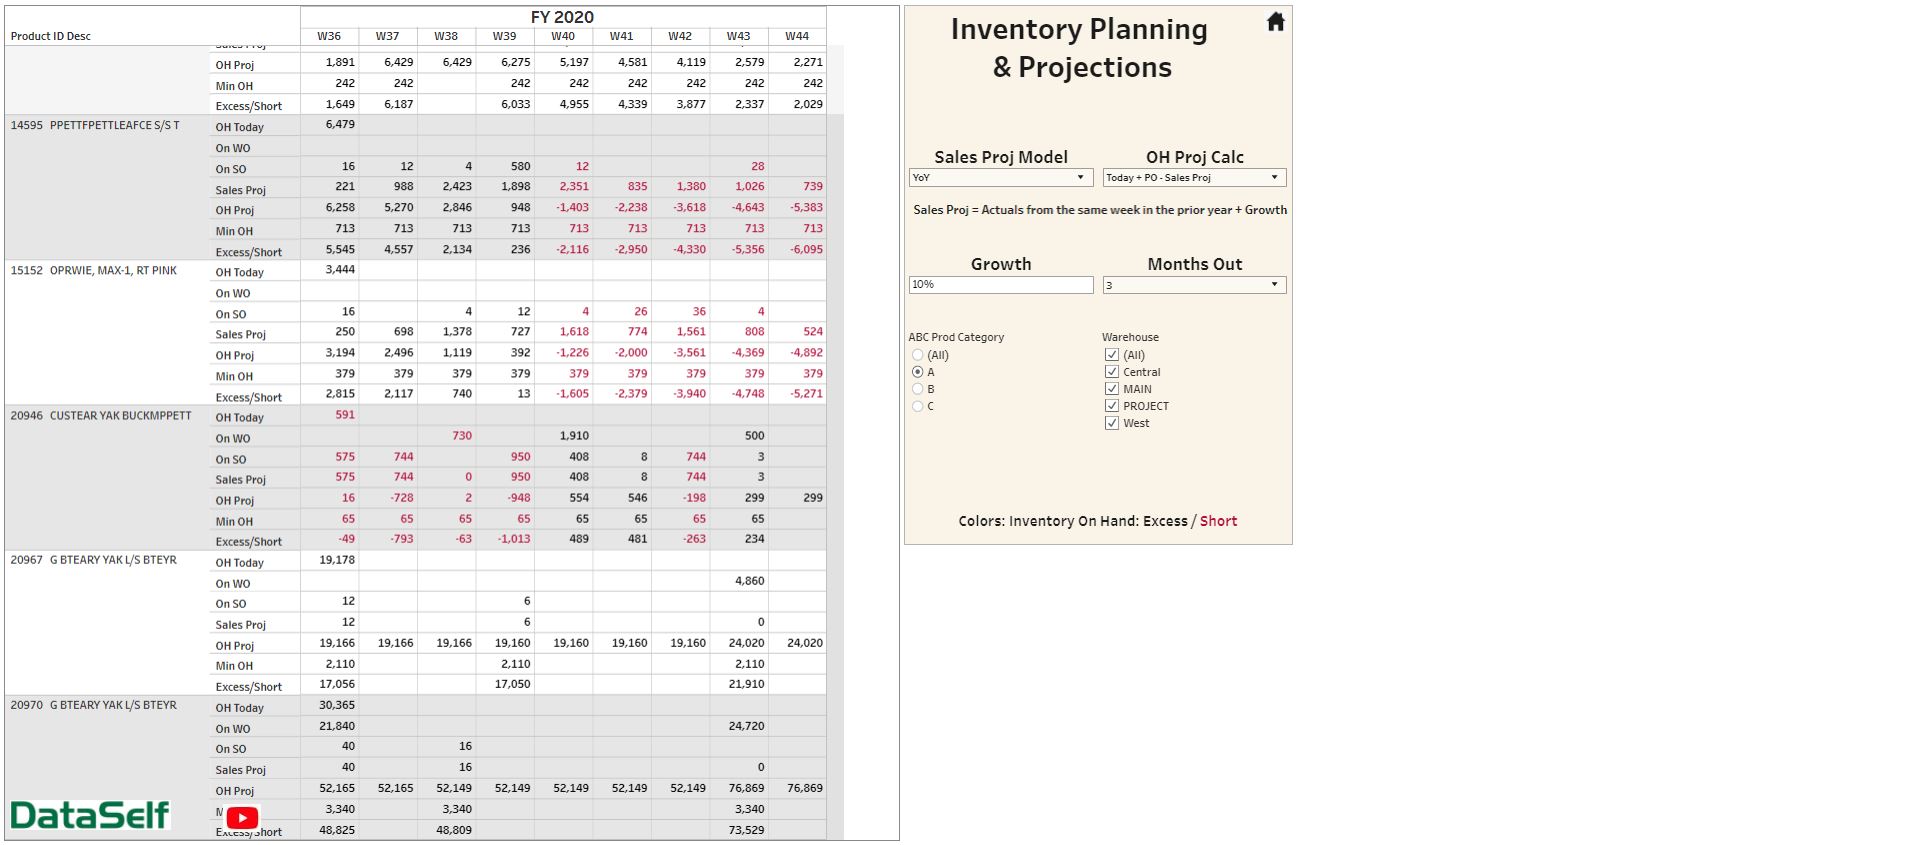
Inventory Planning & Projections
Easy and extensive ways to project finished goods quantity on hand by day/week/period, and this information will feed BOM analysis.
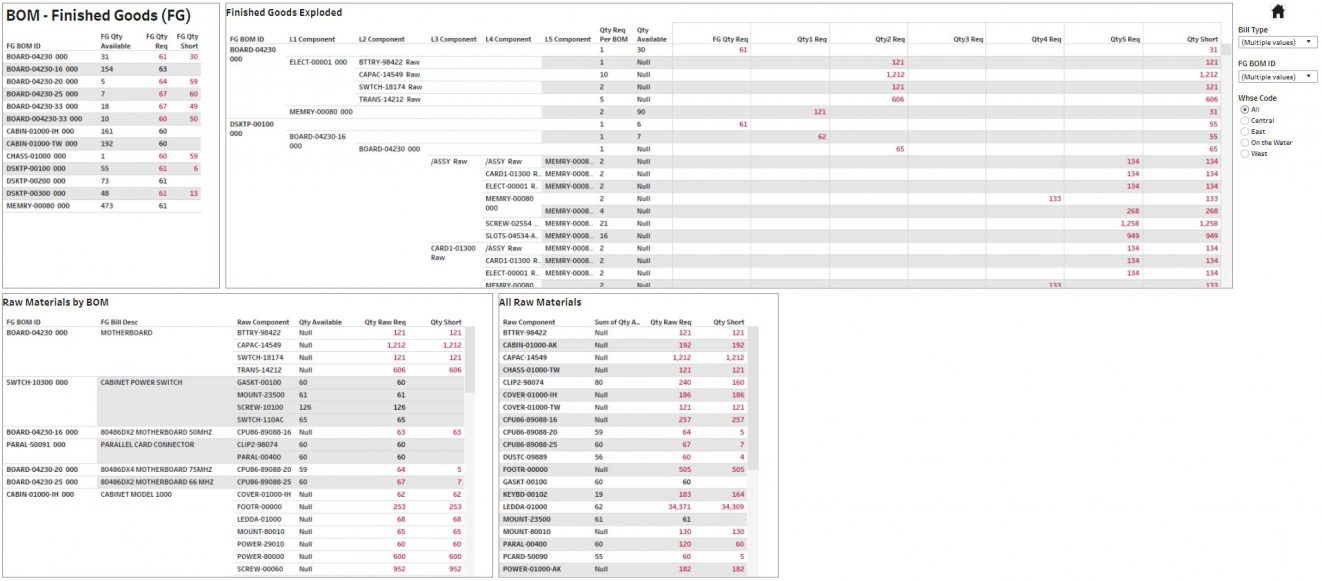
BOM – Bill of Materials
Extensive ways to analyze finished goods, single and multi-level bill of materials, at the exploded and raw material levels.
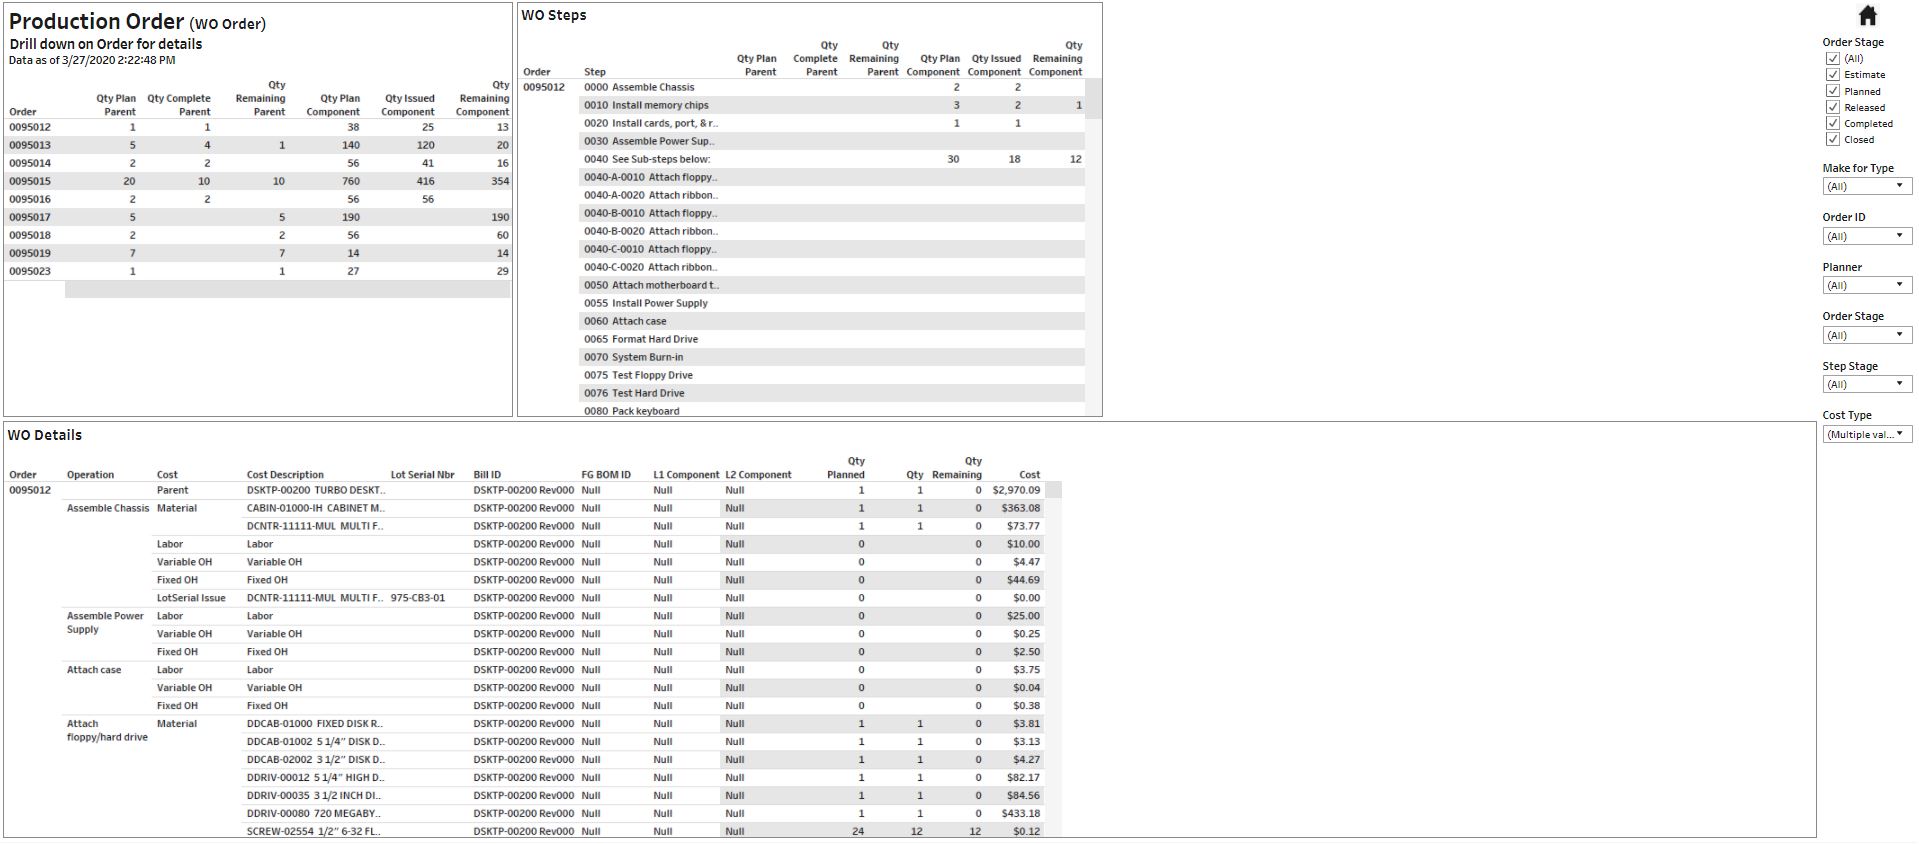
Production / Work Order
Easy ways to analyze production orders and their steps and details.
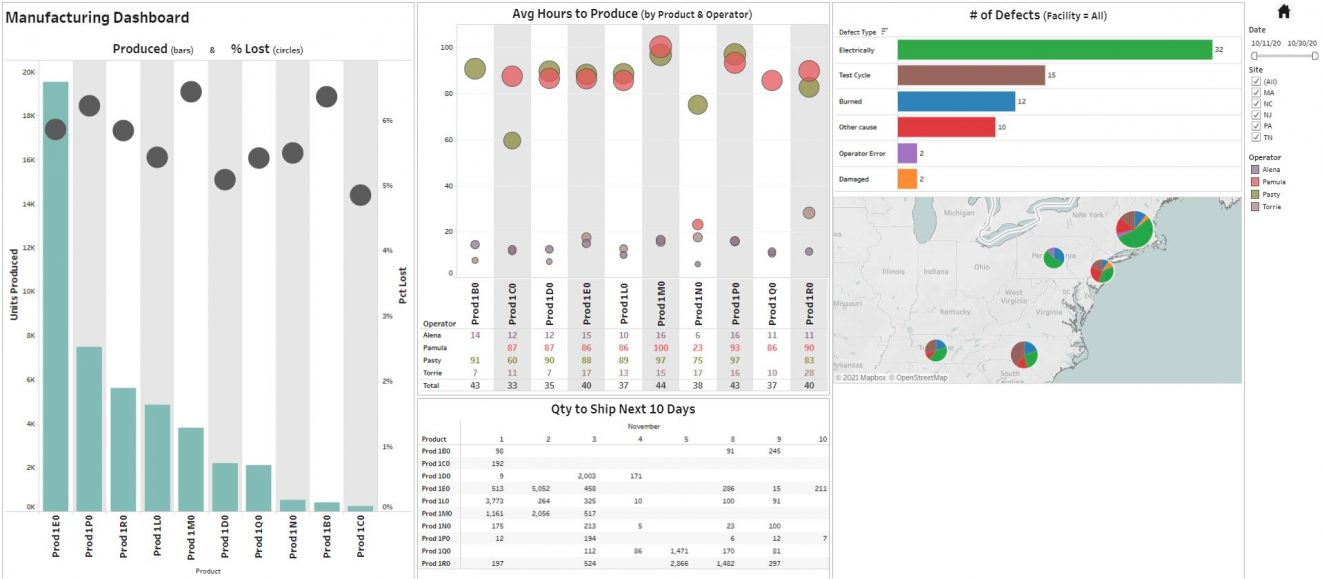
Manufacturing Dashboards
Provide interactive ways to keep track of main KPIs, as well as drill down to details.
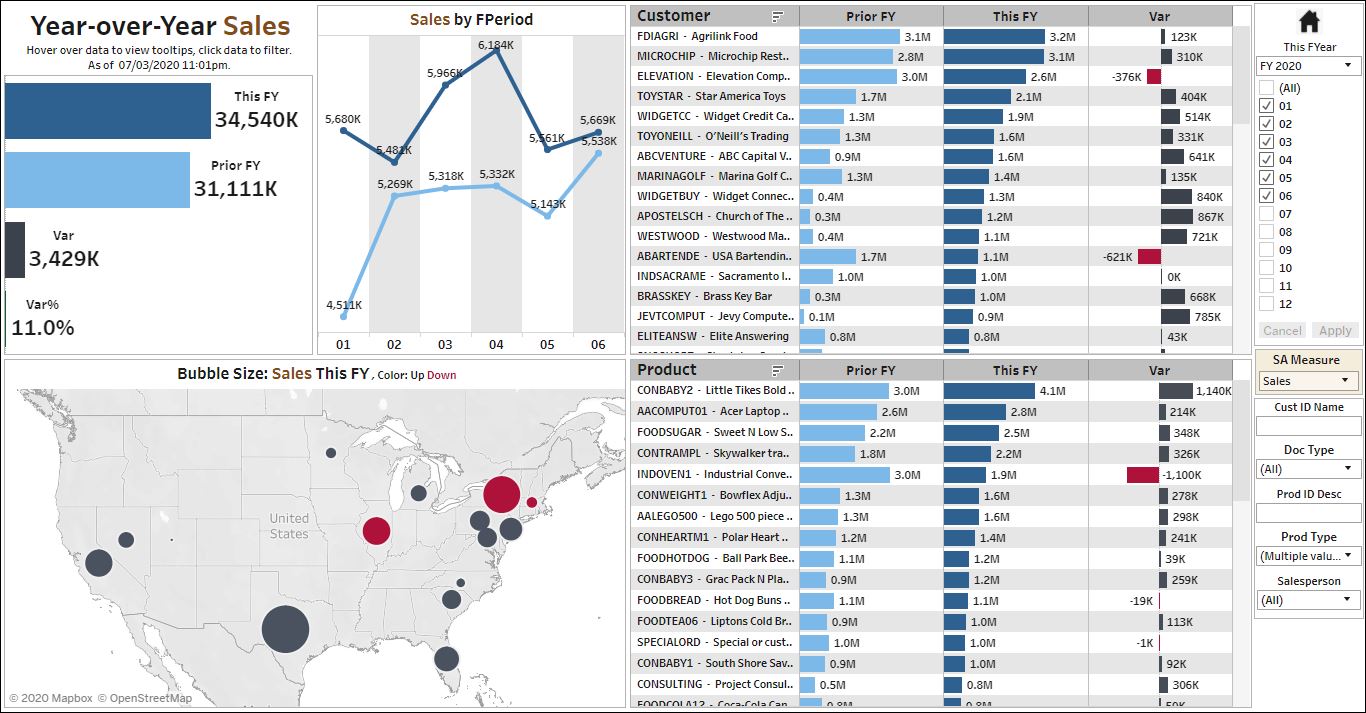
Sales (Invoices)
Year-Over-Year
Easy and extensive ways to slice and dice sales information in this year, as well as comparing to the same period last year.
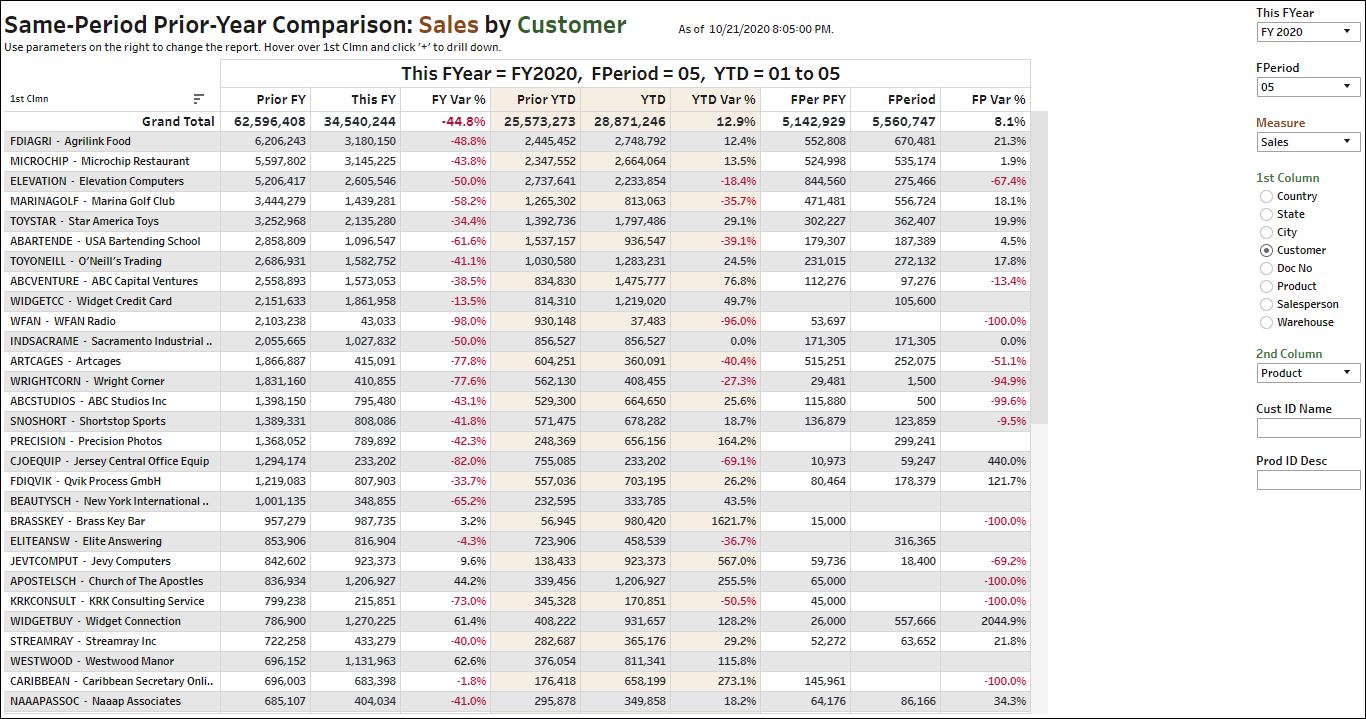
Same-Period Prior-Year Comparison: Sales by Customer
Use parameters on the right to change the report. Hover over 1st Clmn and click ‘+’ to drill down.
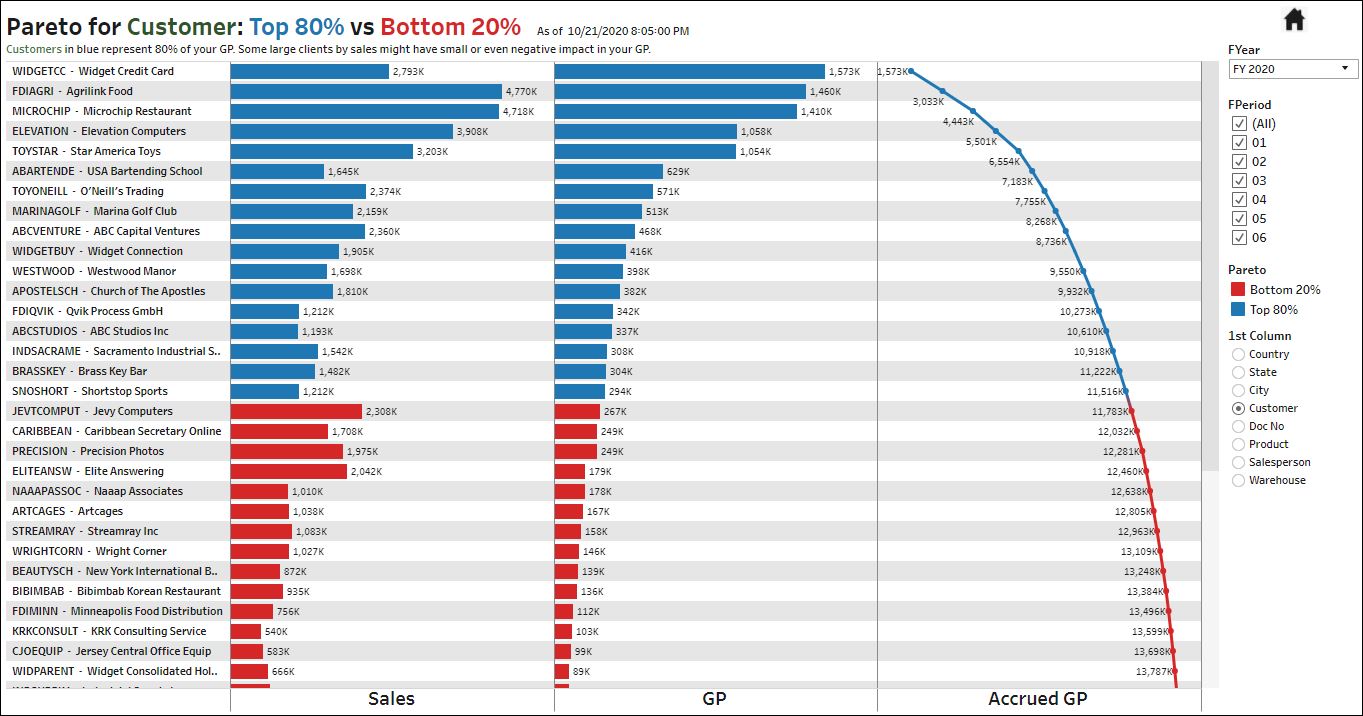
Pareto for Customer
Customers in blue represent 80% of your GP. Some large clients by sales might have small or even negative impact in your GP.
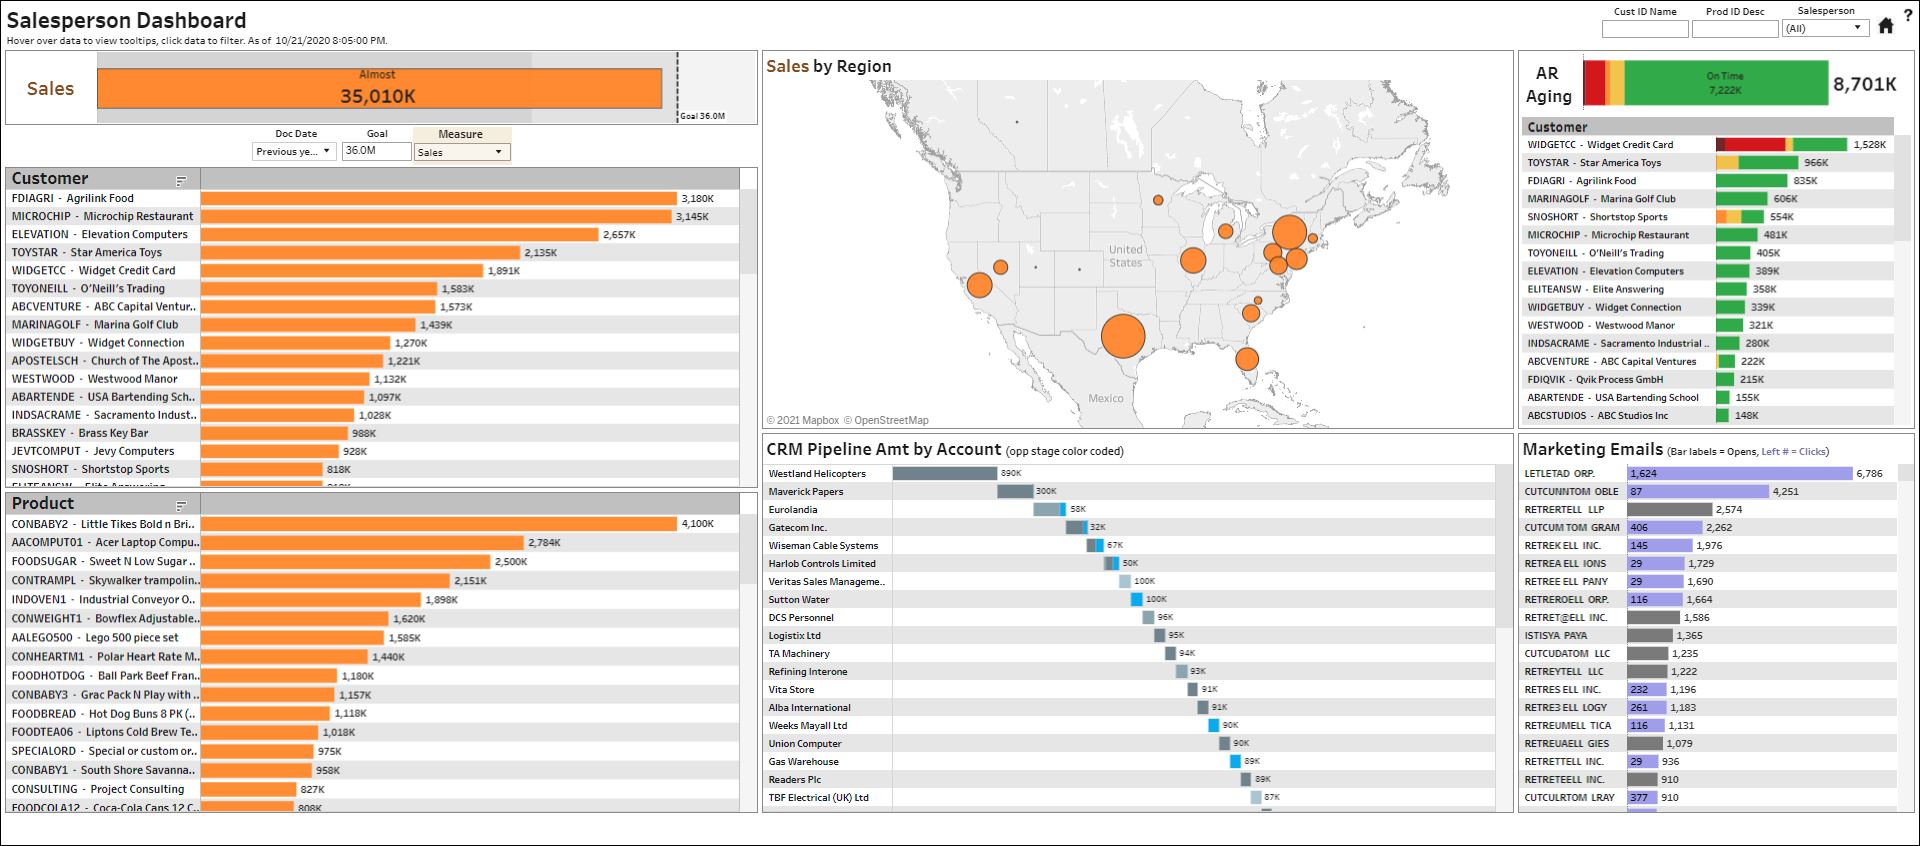
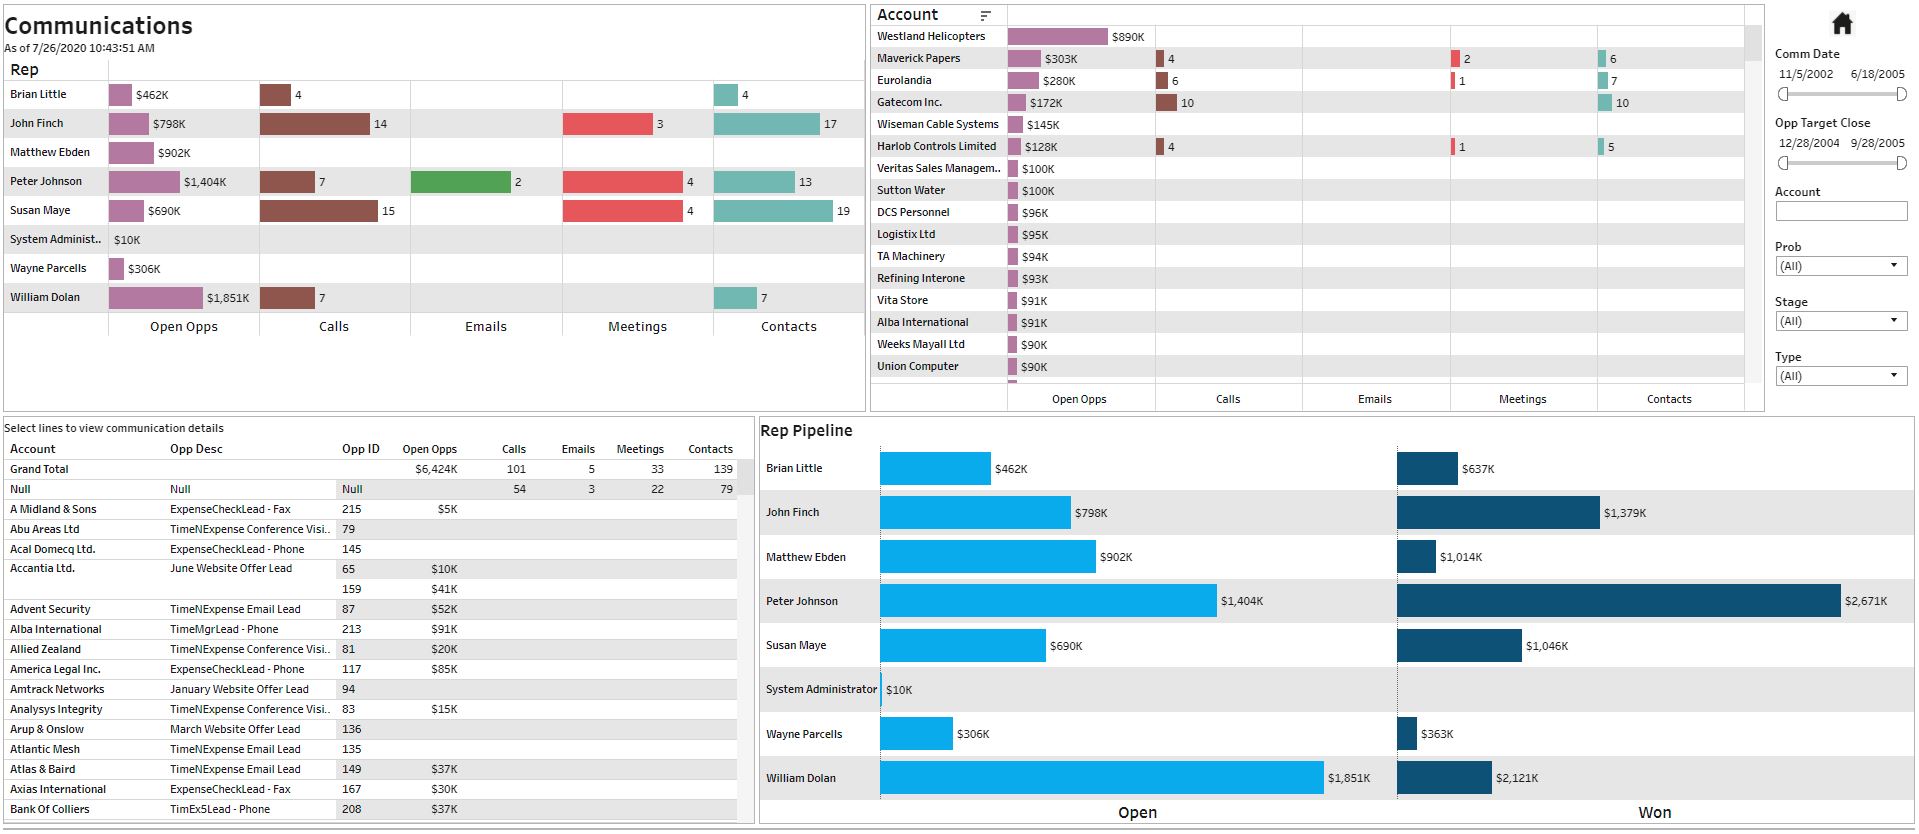
Salesperson Dashboard
Provides a 360-degree view of customer touch points. This example requires Sales, CRM Opportunities, AR Aging, and Email Marketing.
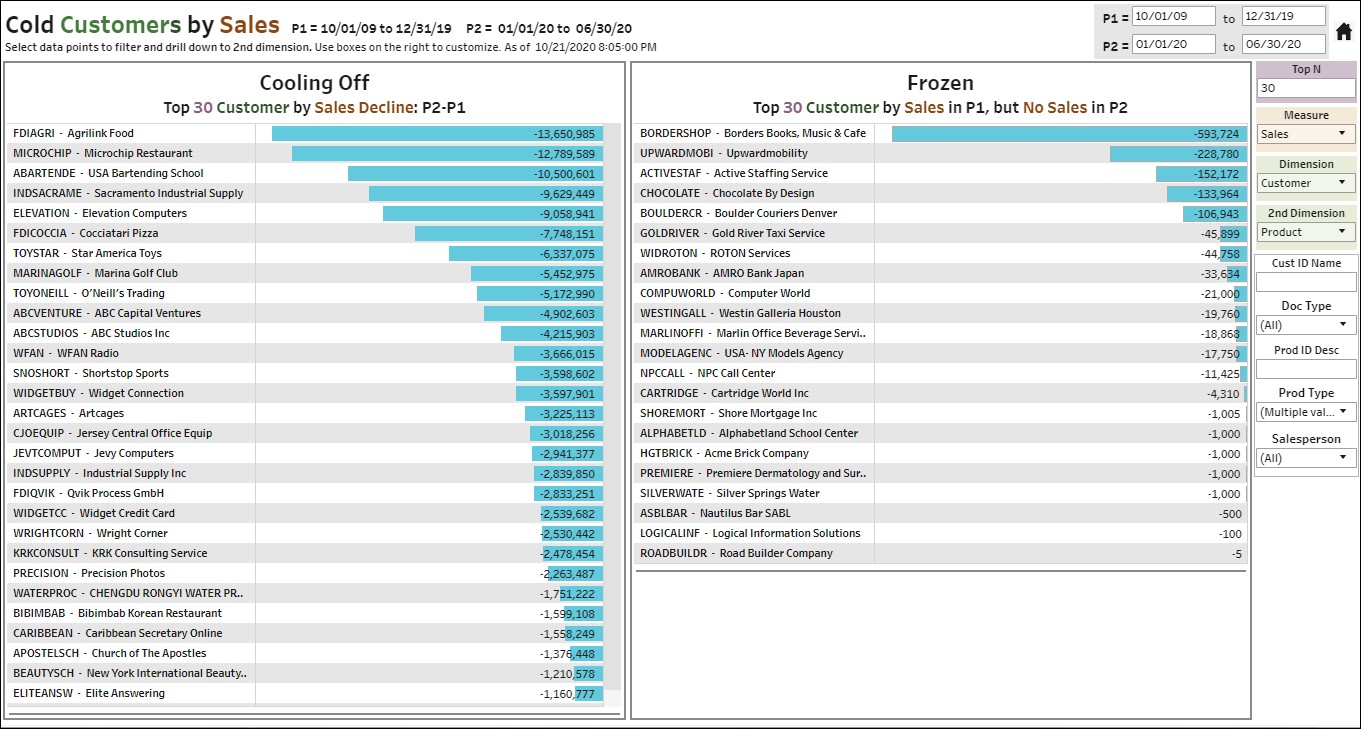
Cold Customers by Sales
Select data points to filter and drill down to 2nd dimension. Use boxes on the right to customize.
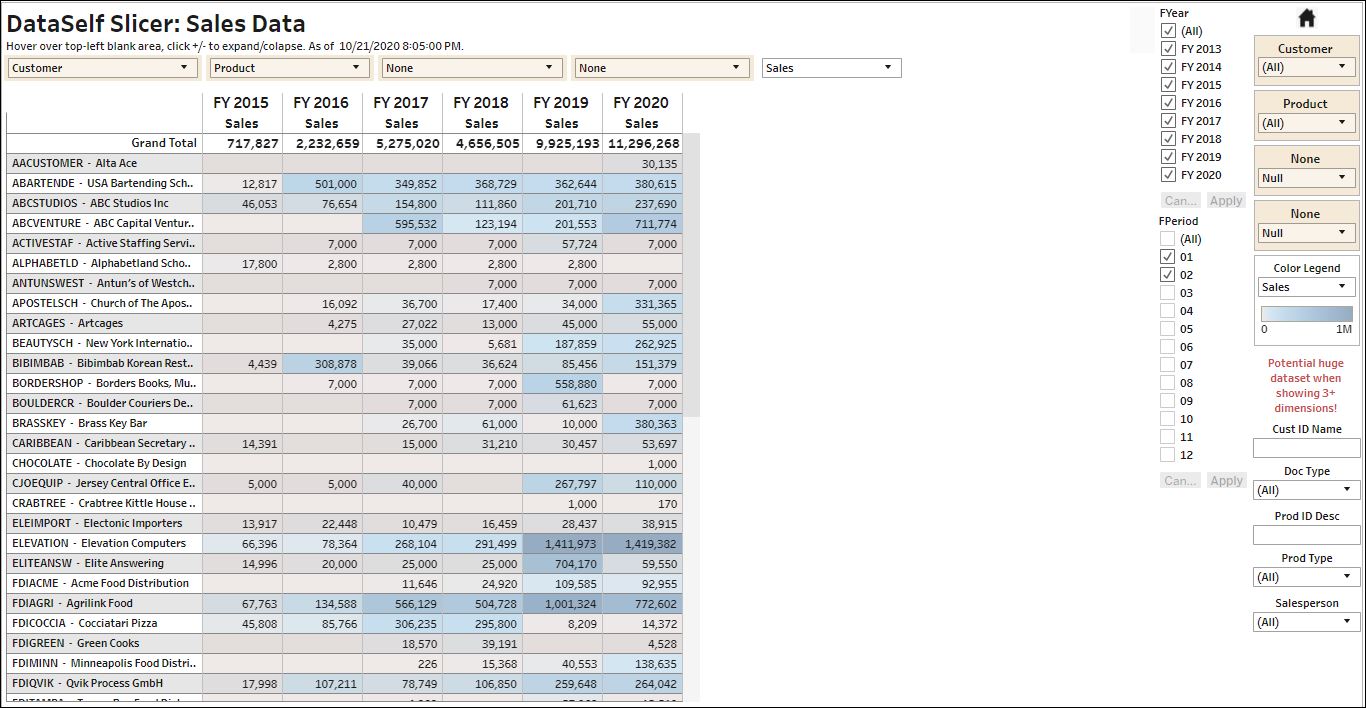
DataSelf Slicer: Sales Data
Hover over top-left blank area, click +/- to expand/colapse.
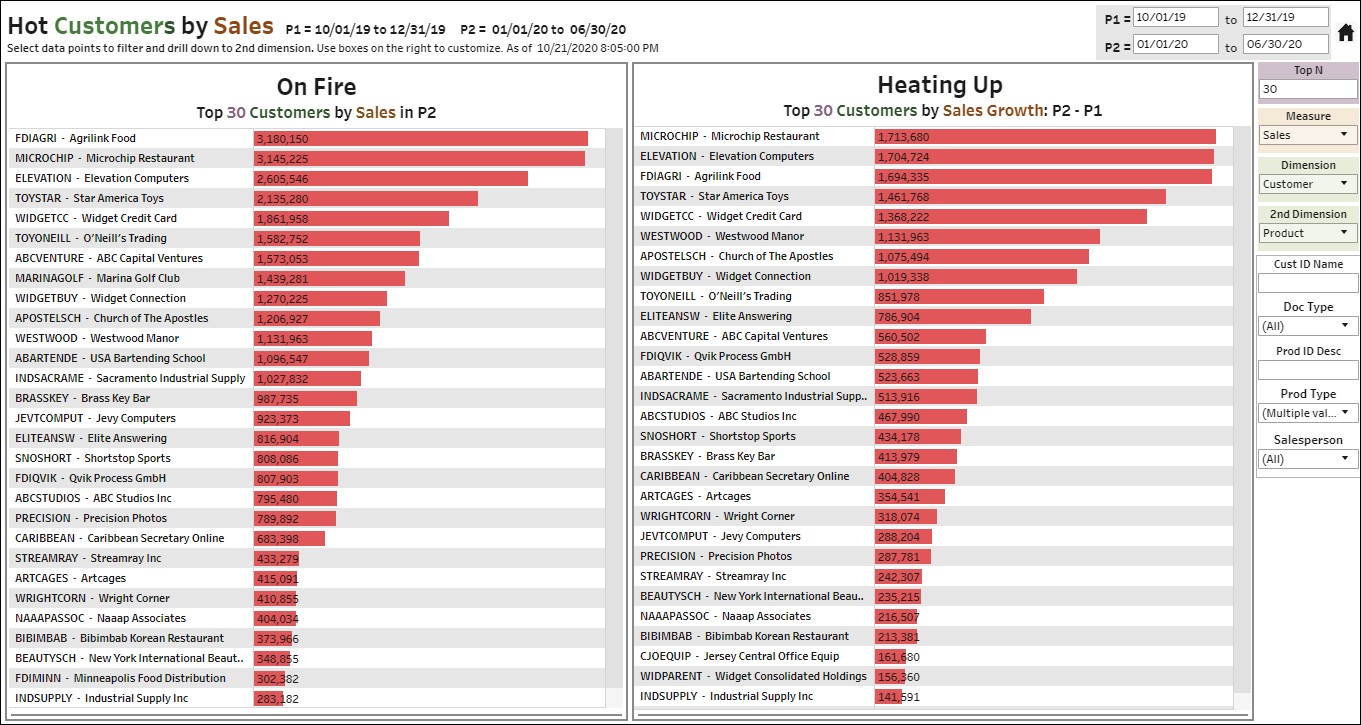
Hot Customers by Sales
Select data points to filter and drill down to 2nd dimension. Use boxes on the right to customize.
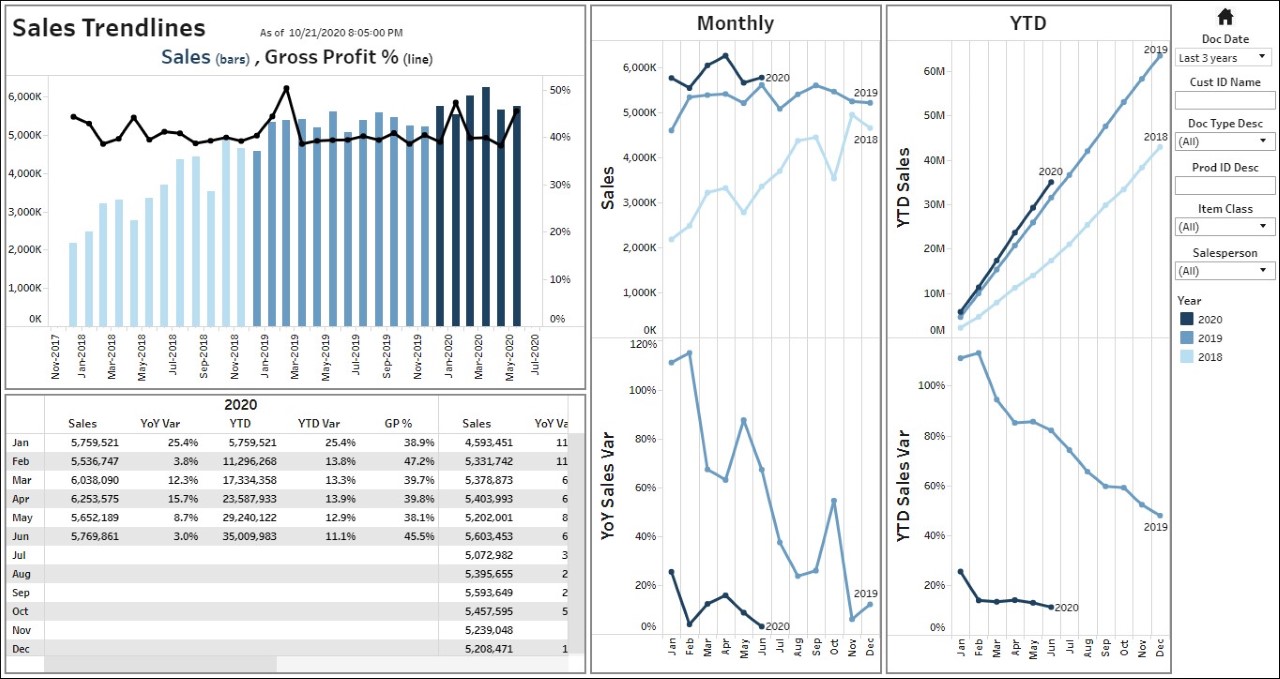
Sales Trendlines
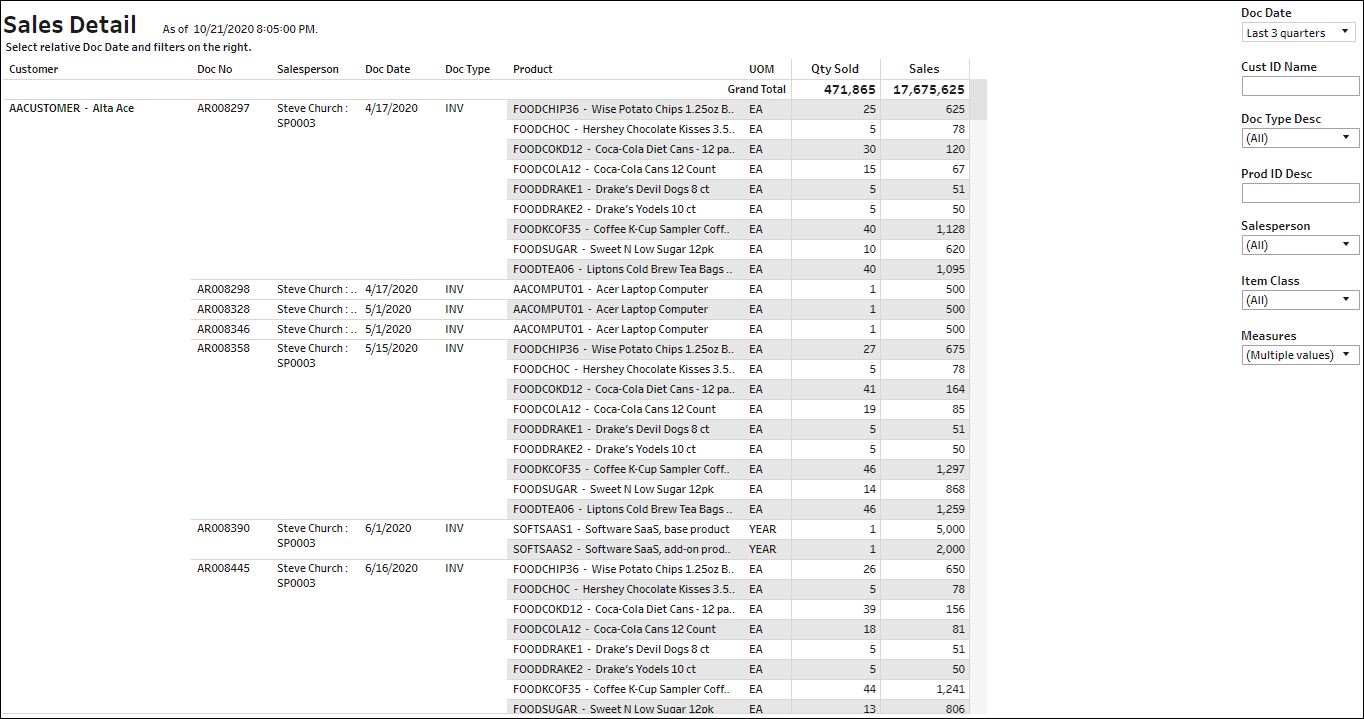
Sales Details
Select relative Doc Date and filters on the right.
.
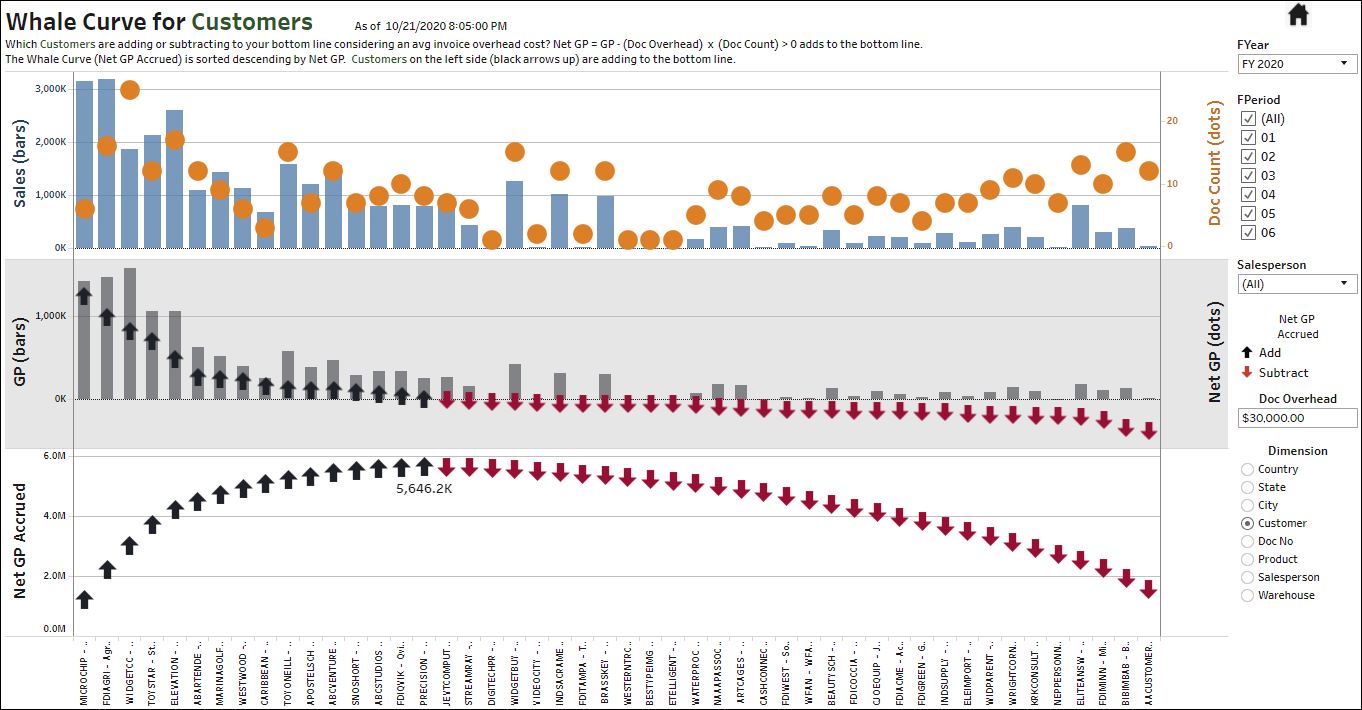
Whale Curve for Customers
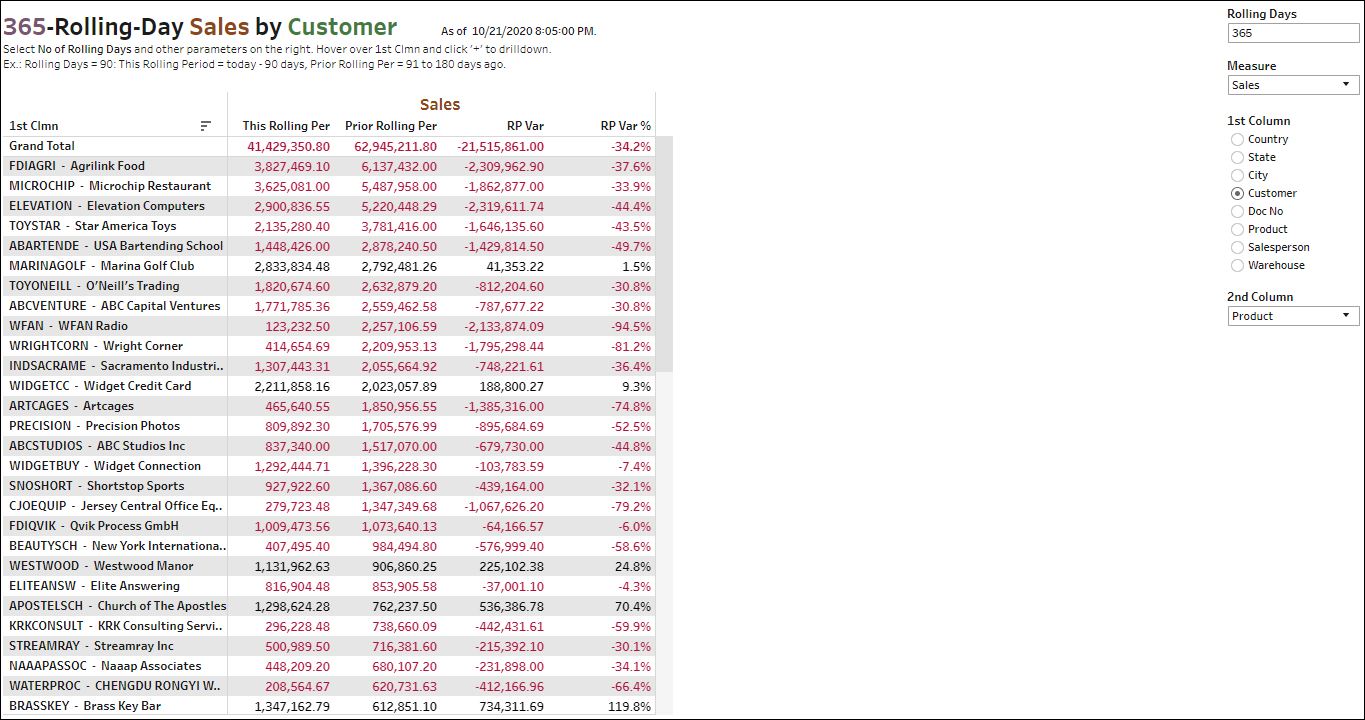
365-Rolling-Day Sales by Customer
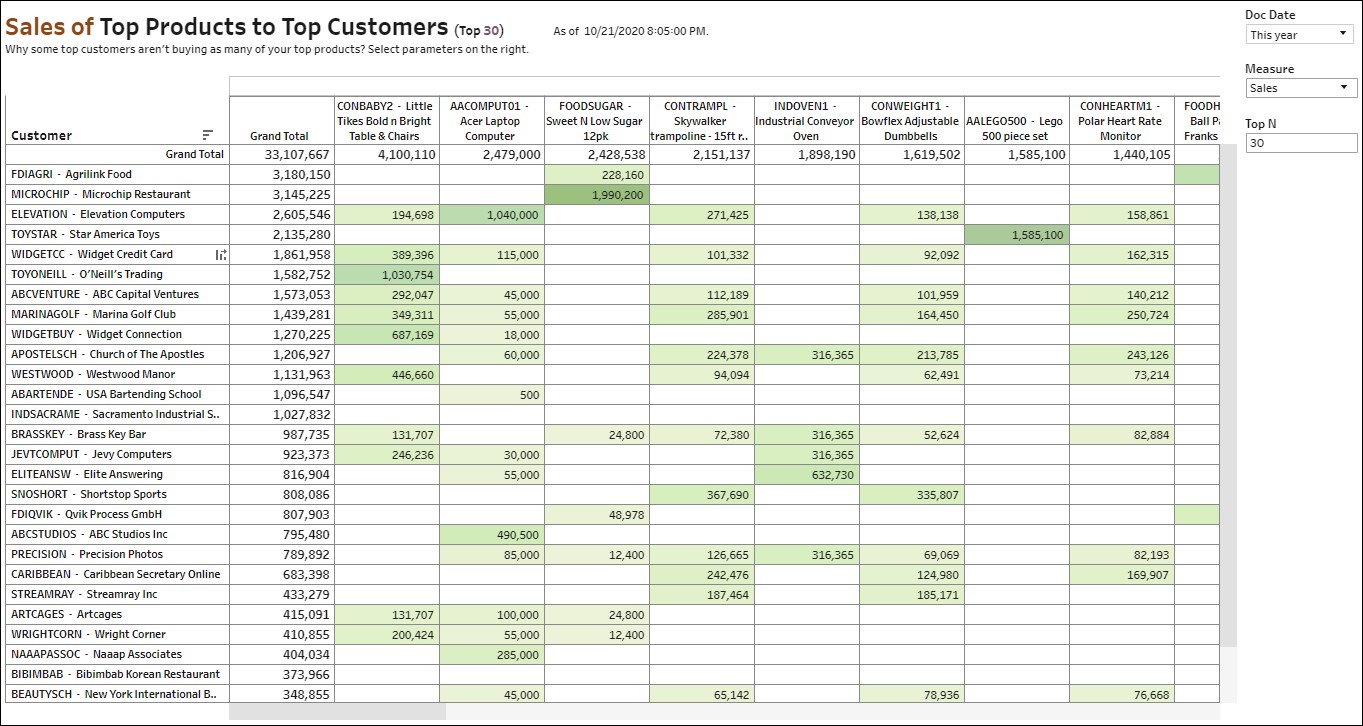
Sales of Top Products to Top Customers
Why some top customers aren’t buying as many of your top products? Select parameters on the right.
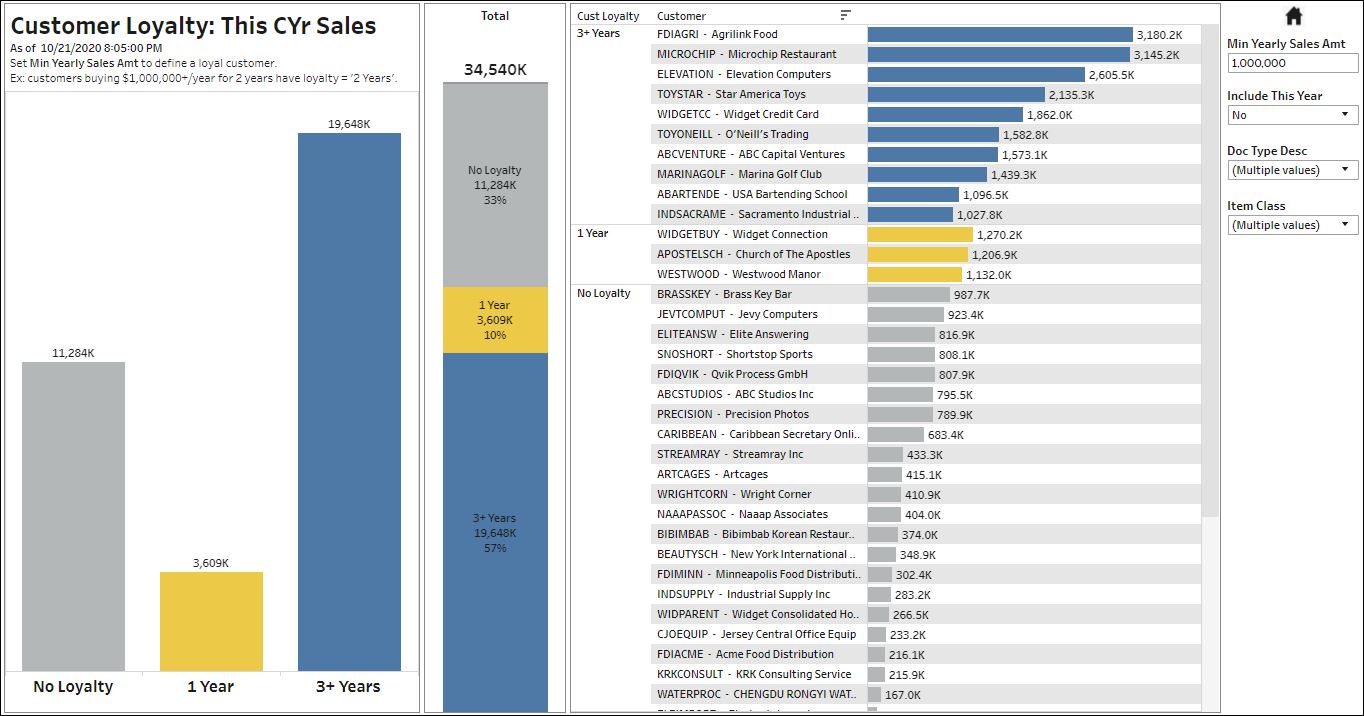
Customer Loyalty: This CYr Sales
Set Min Yearly Sales Amt to define a loyal customer.
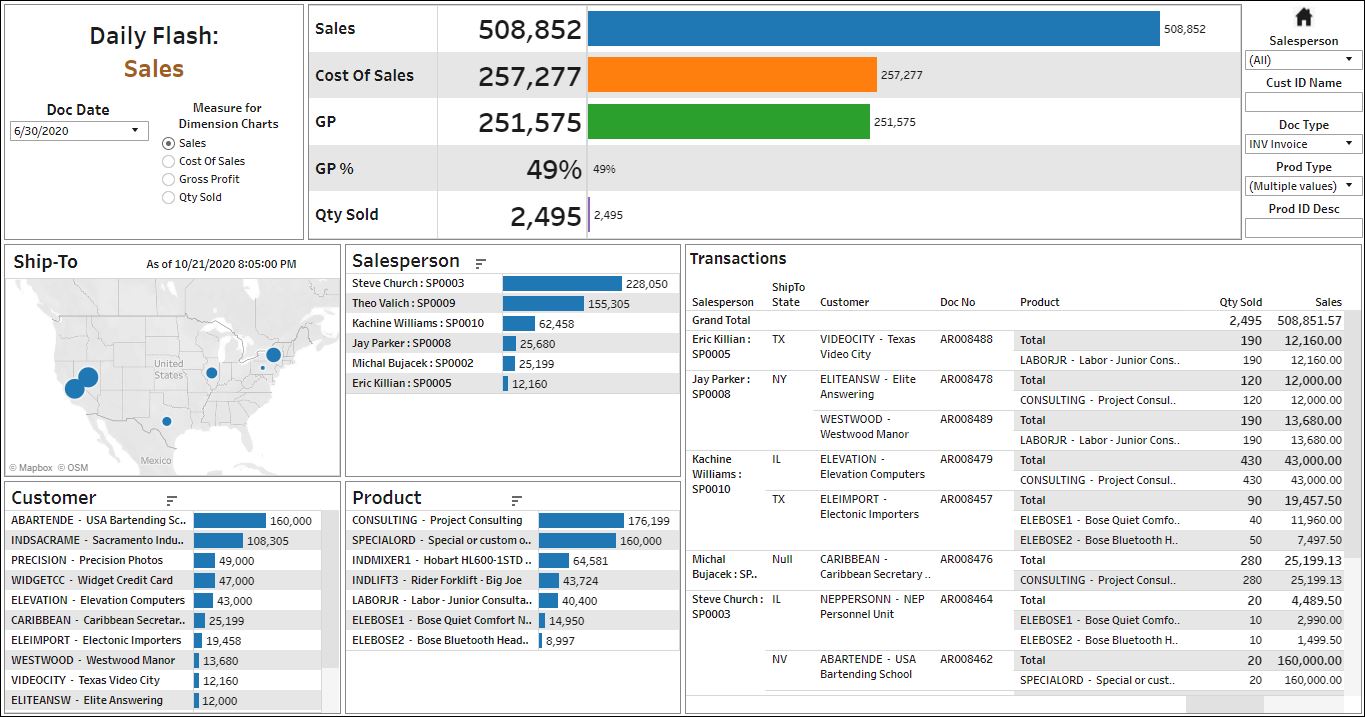
Daily Flash
.
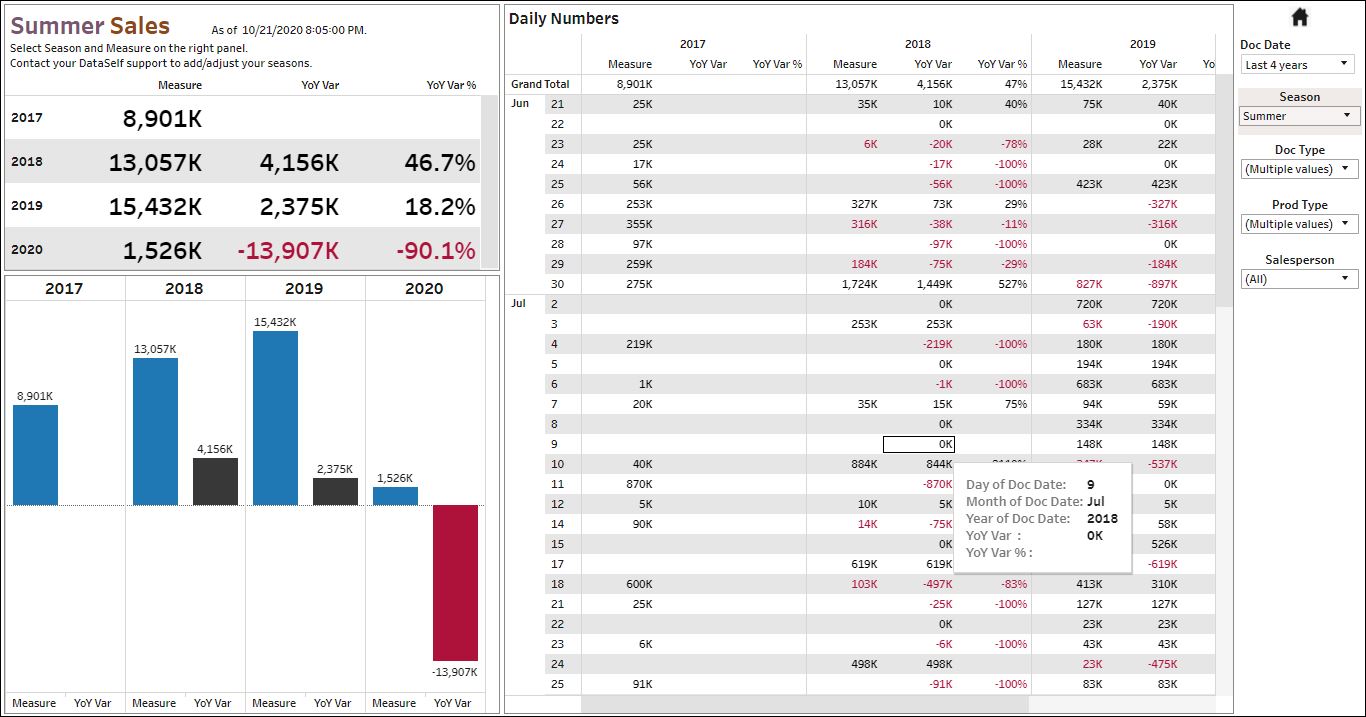
Summer Sales
Select Season and Measure on the right panel. Contact your DataSelf support to add/adjust your seasons.
.
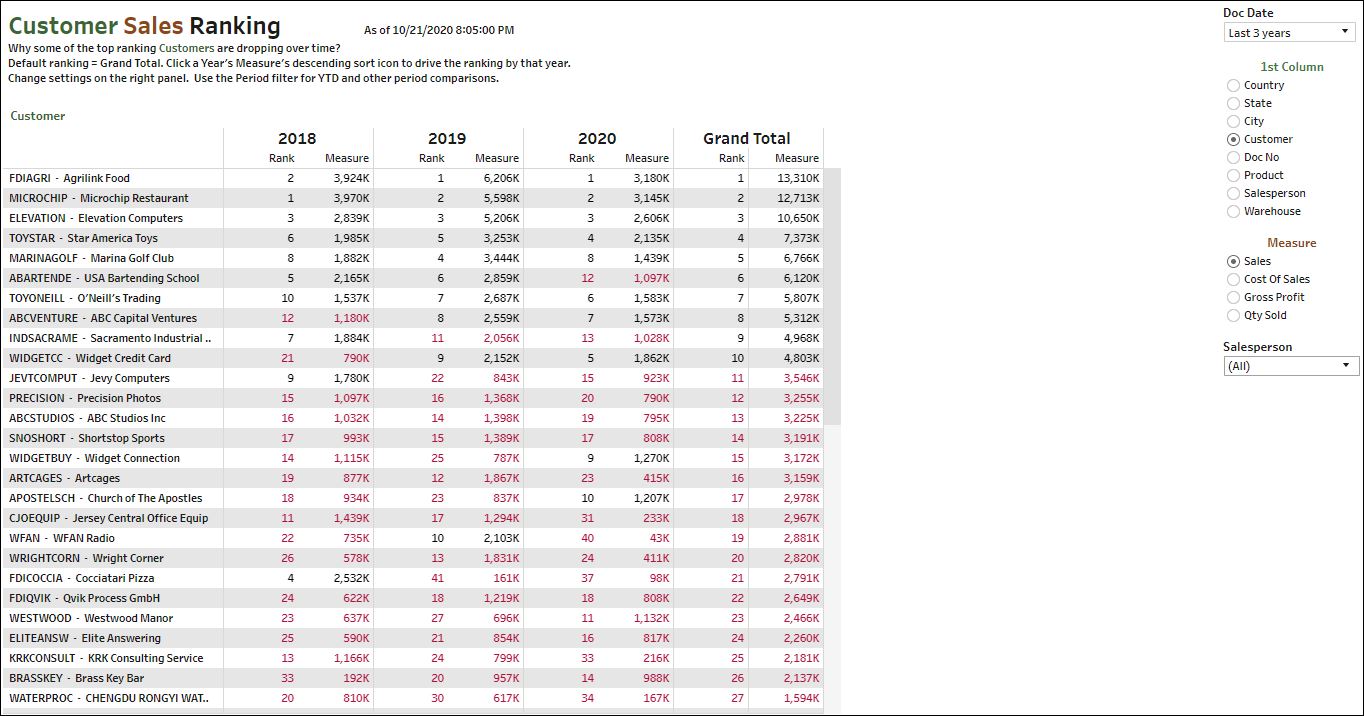
Customer Sales Ranking
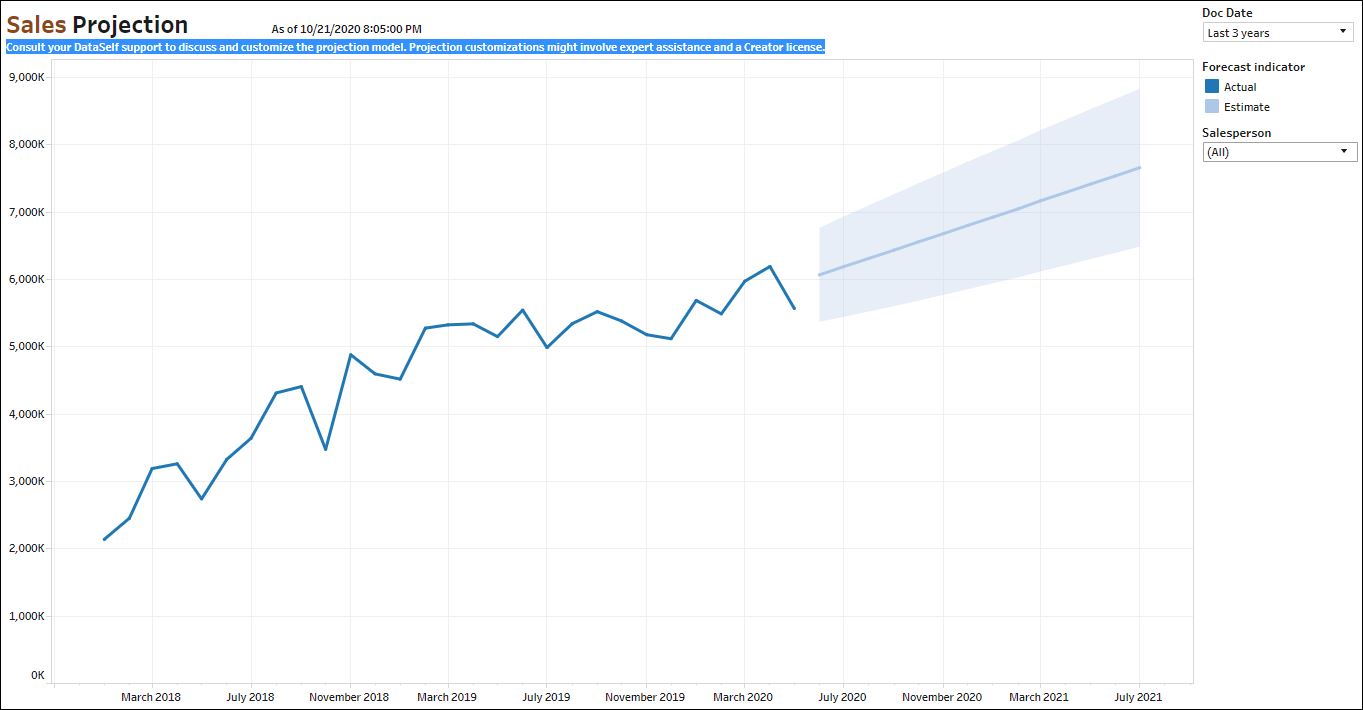
Sales Projection
Sales Order
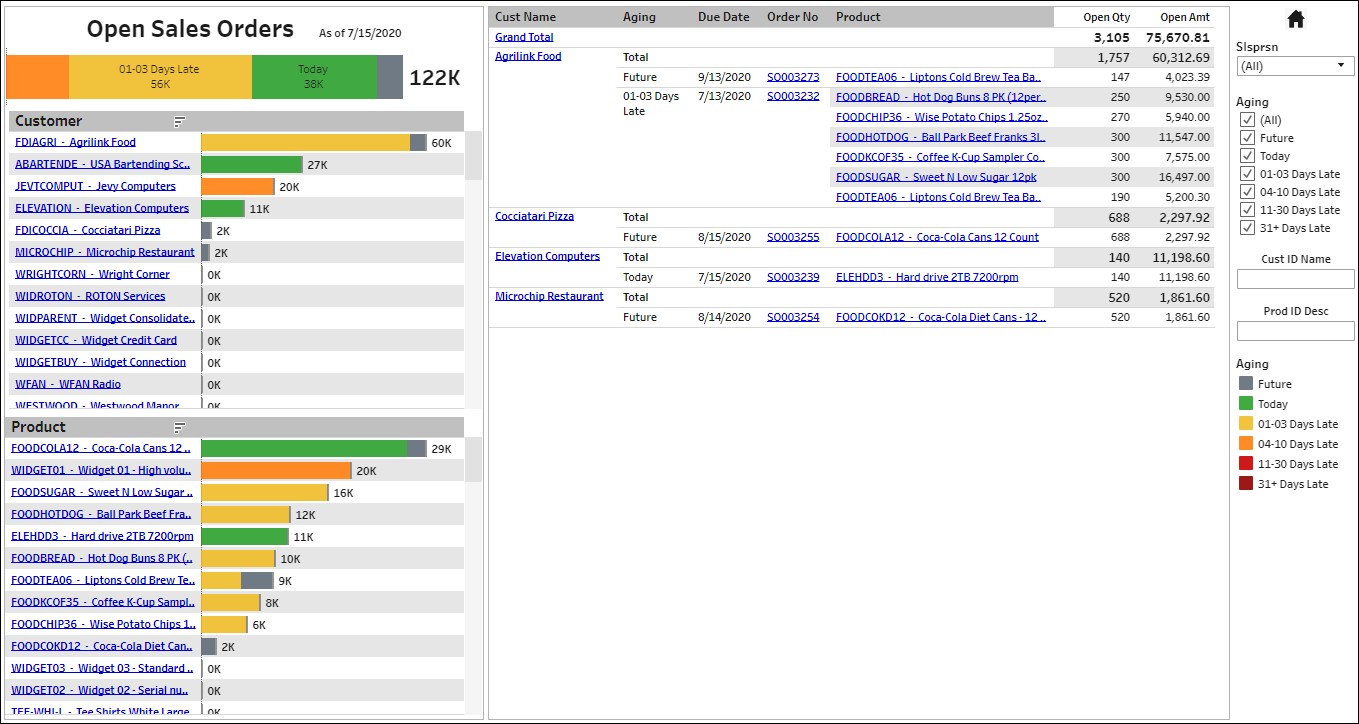
Open Sales Order
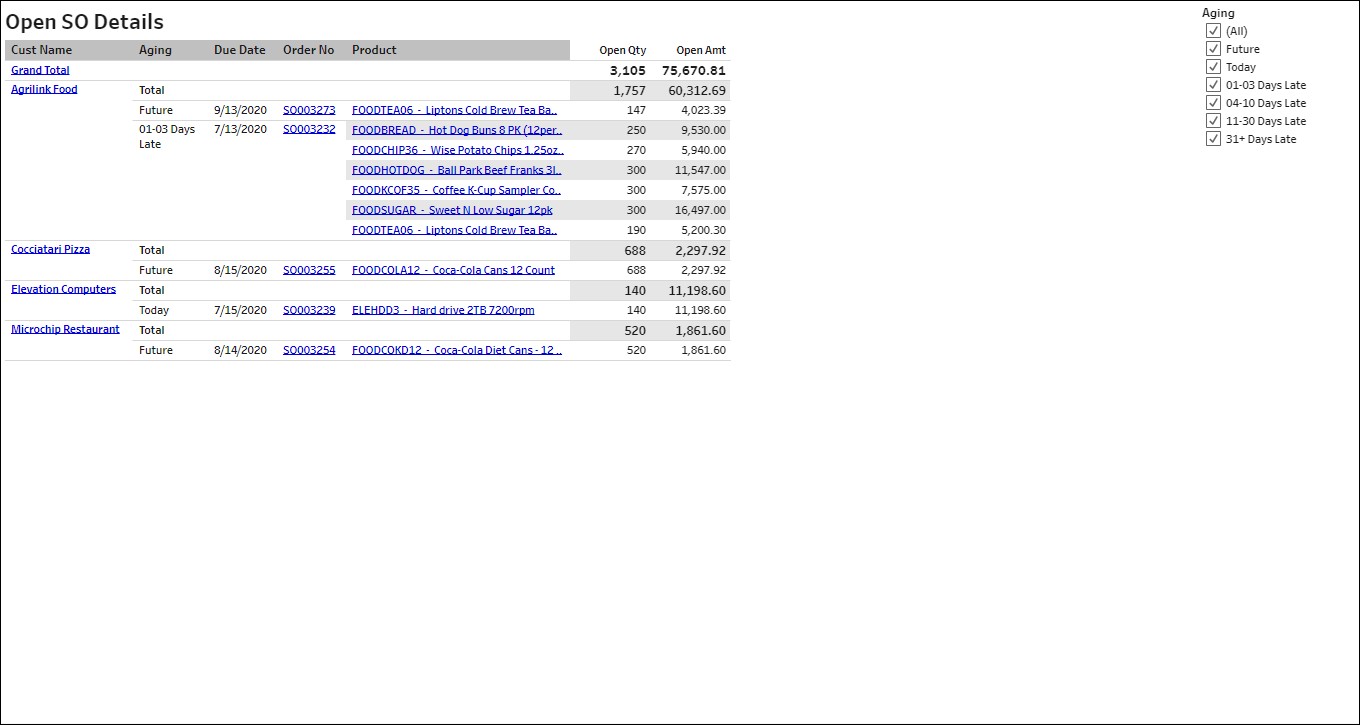
Open Sales Details
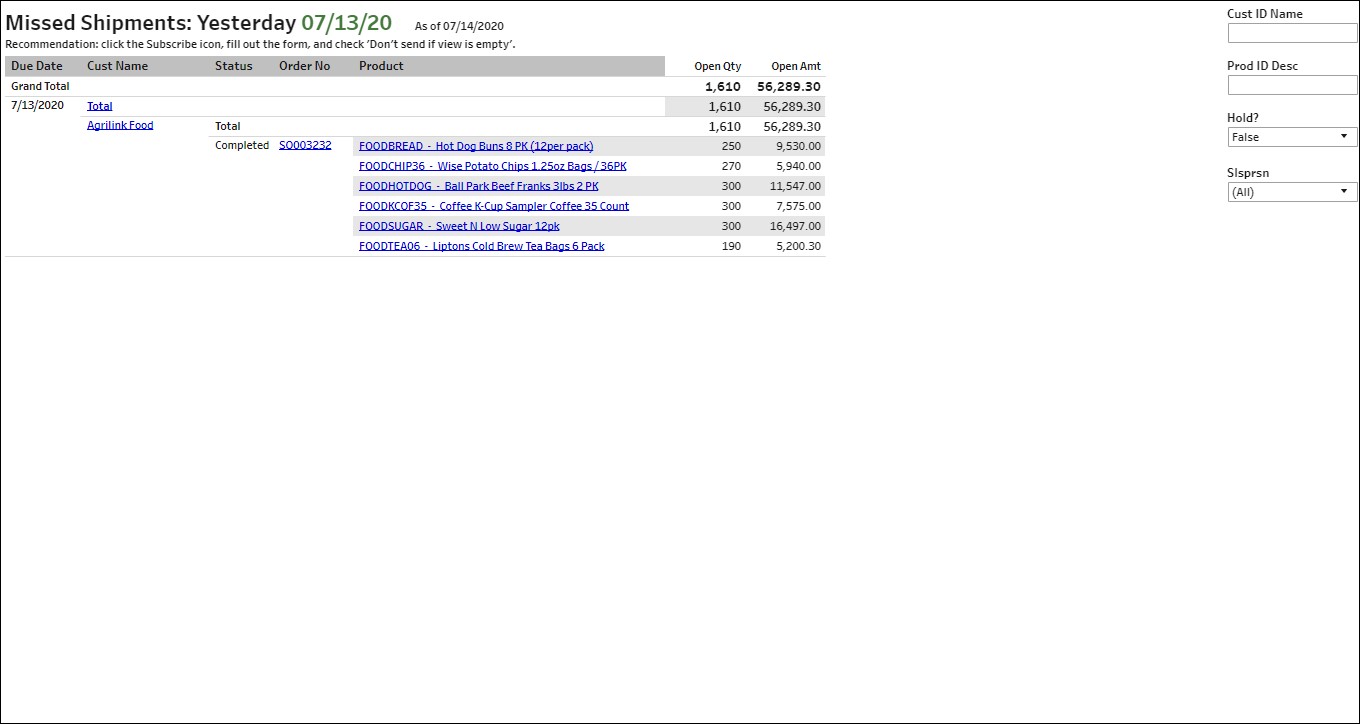
Missed Shipments
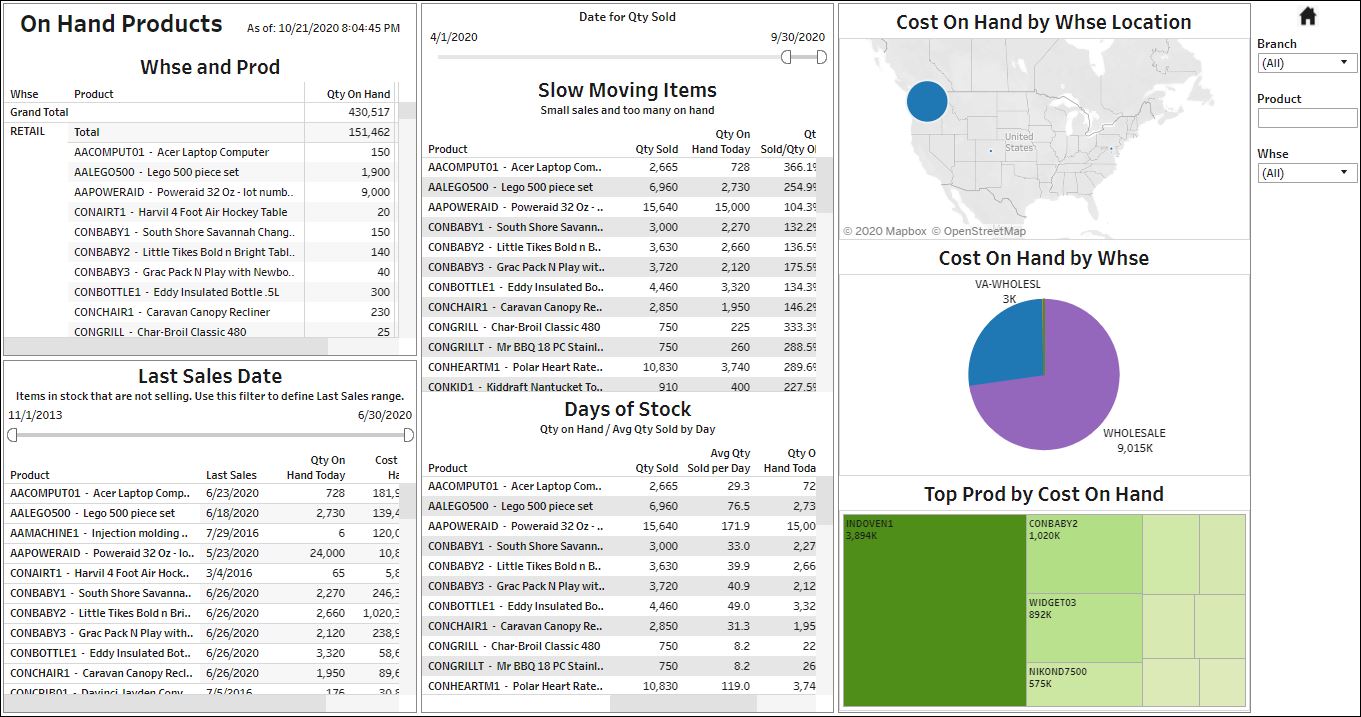
Inventory On Hand Today
On Hand Product
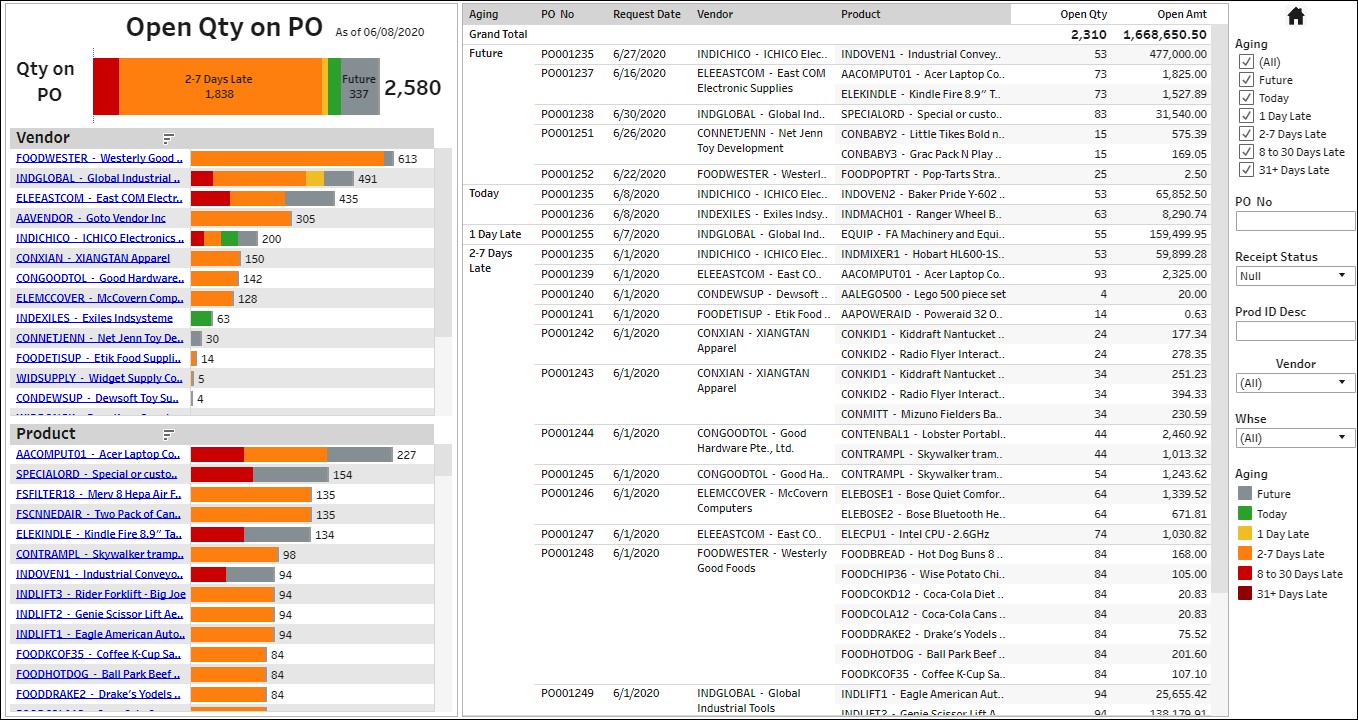
PO Purchase Order
Open Qty on PO
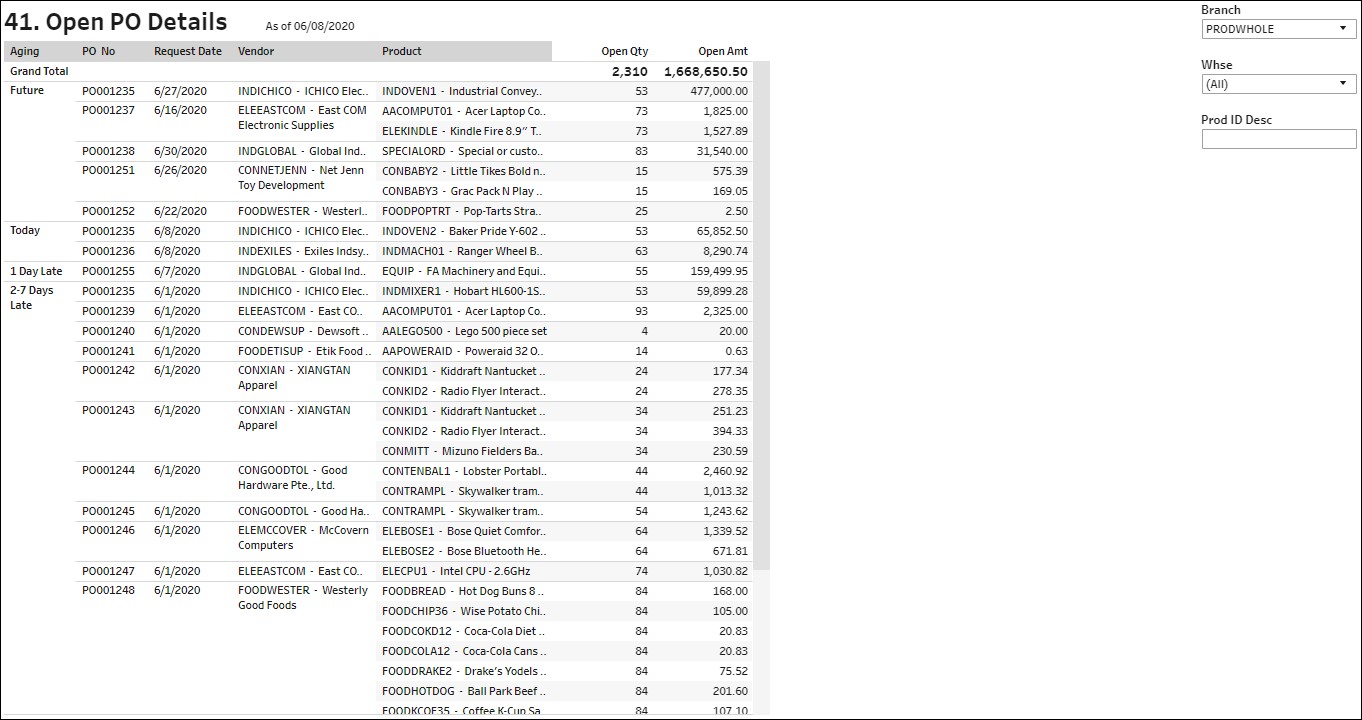
Open PO Details
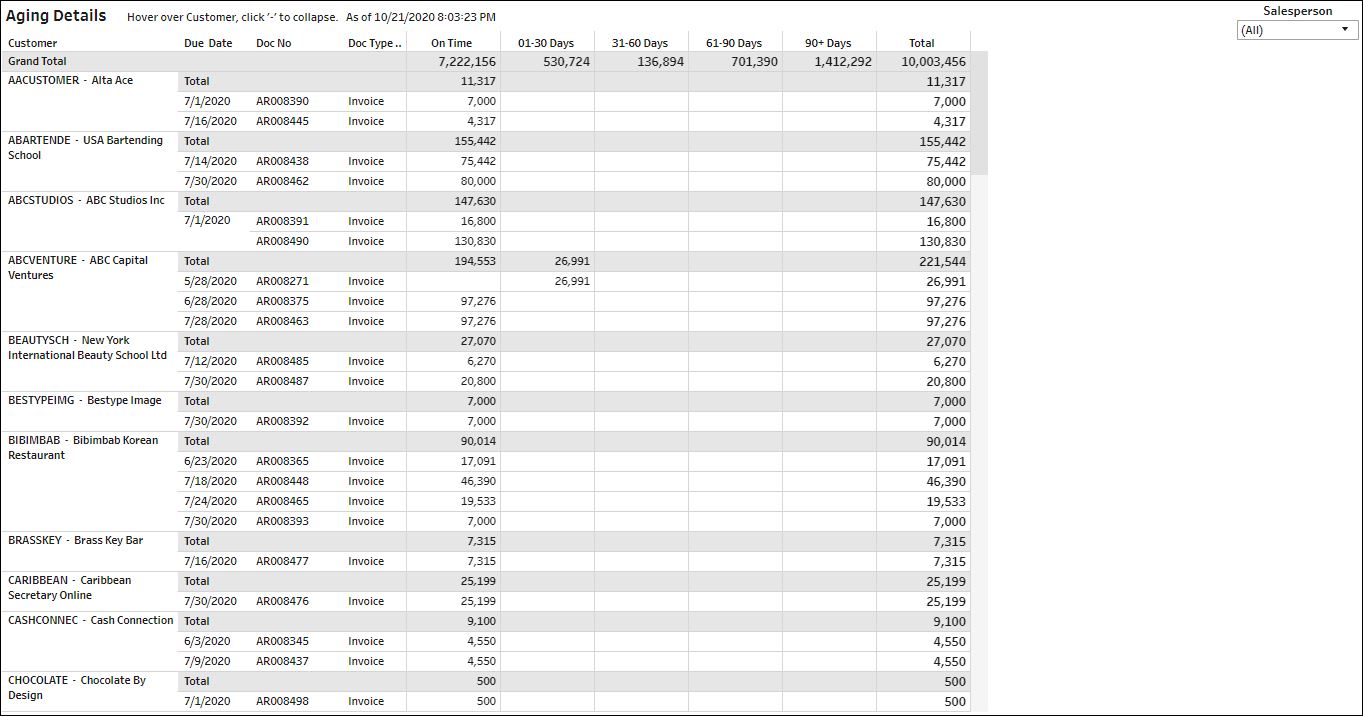
AR Aging
AR Aging
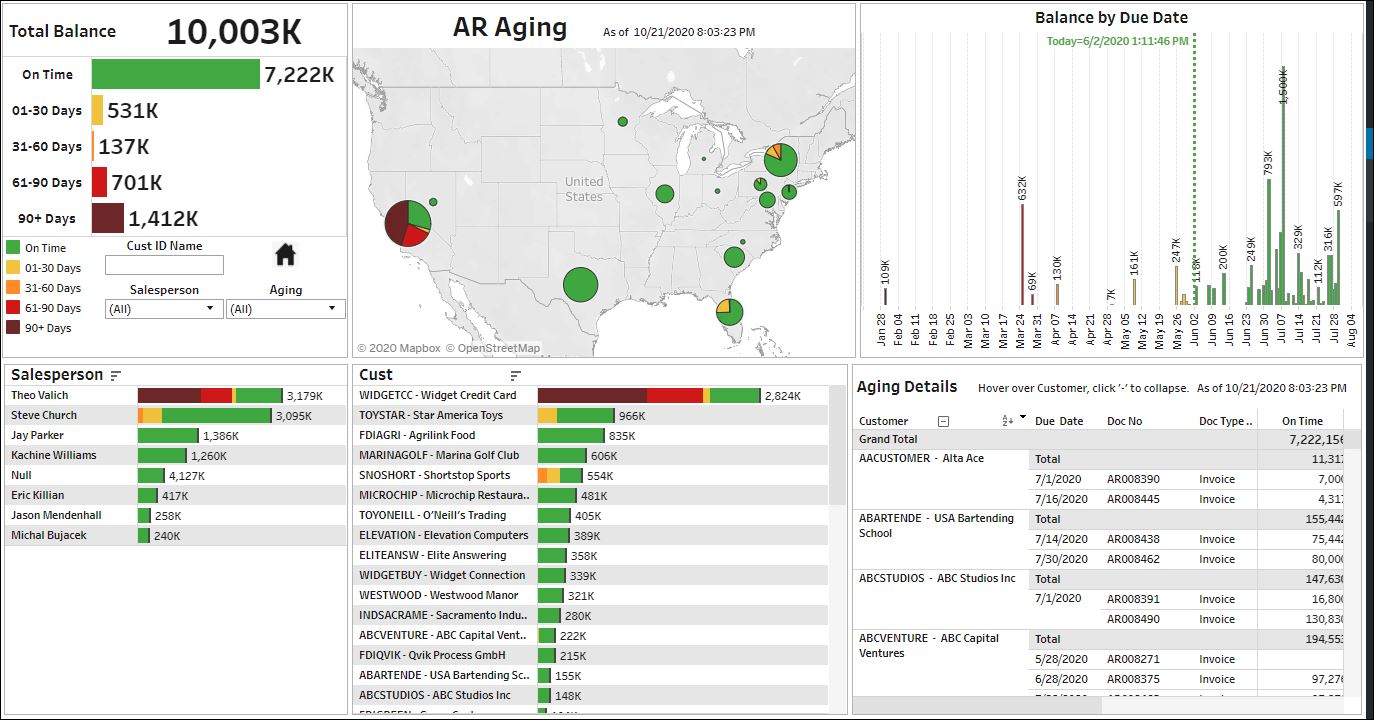
AR Aging Details
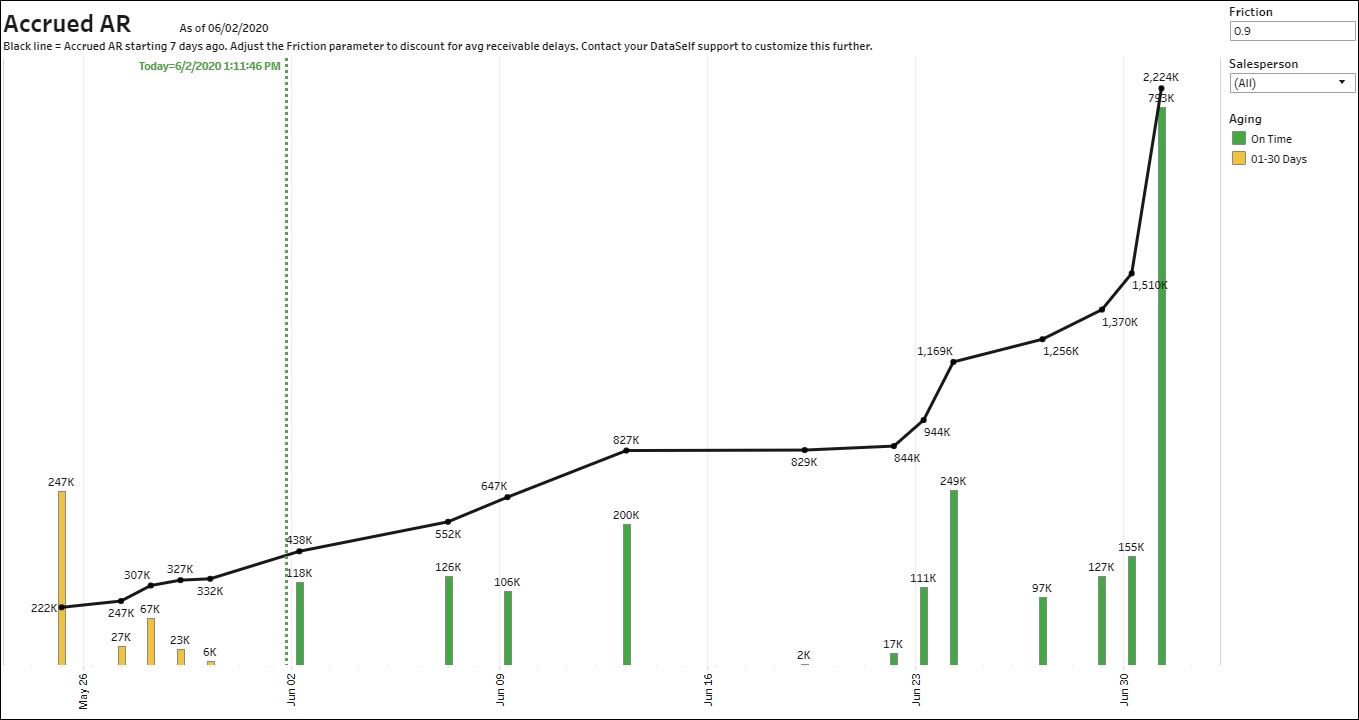
Accrued AR
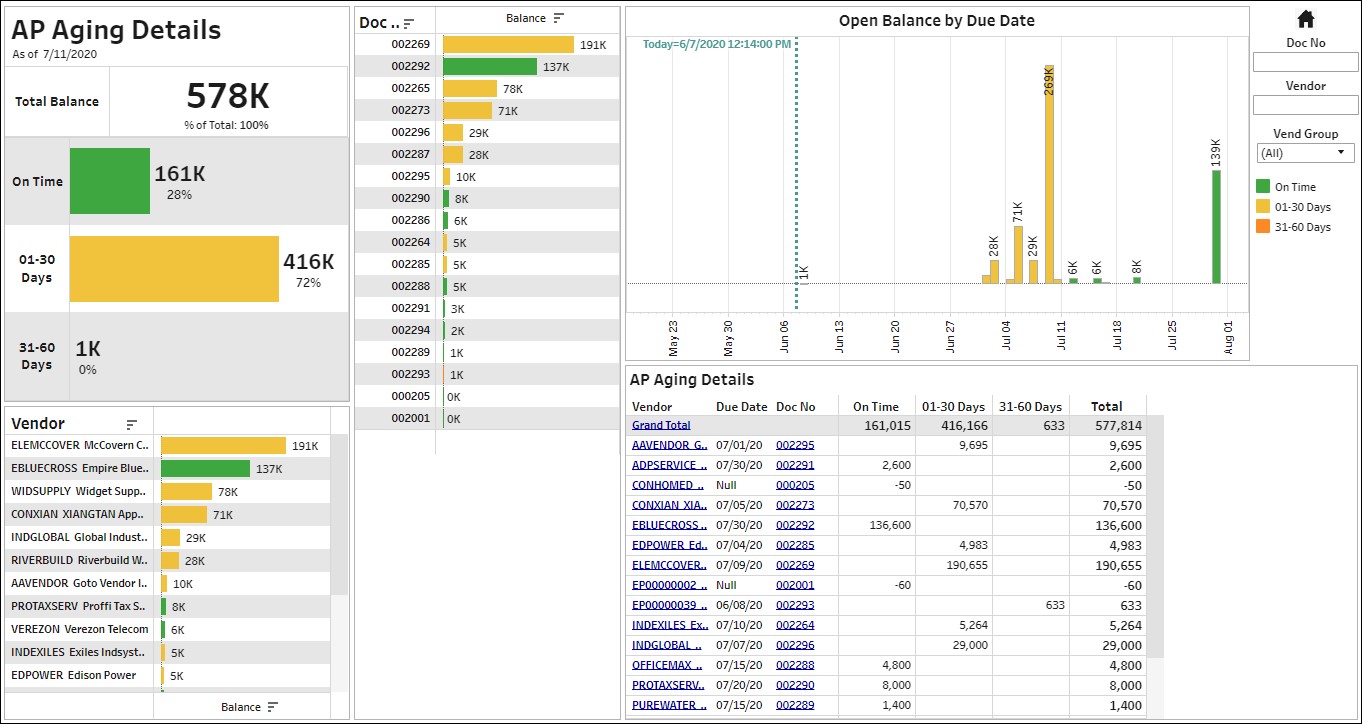
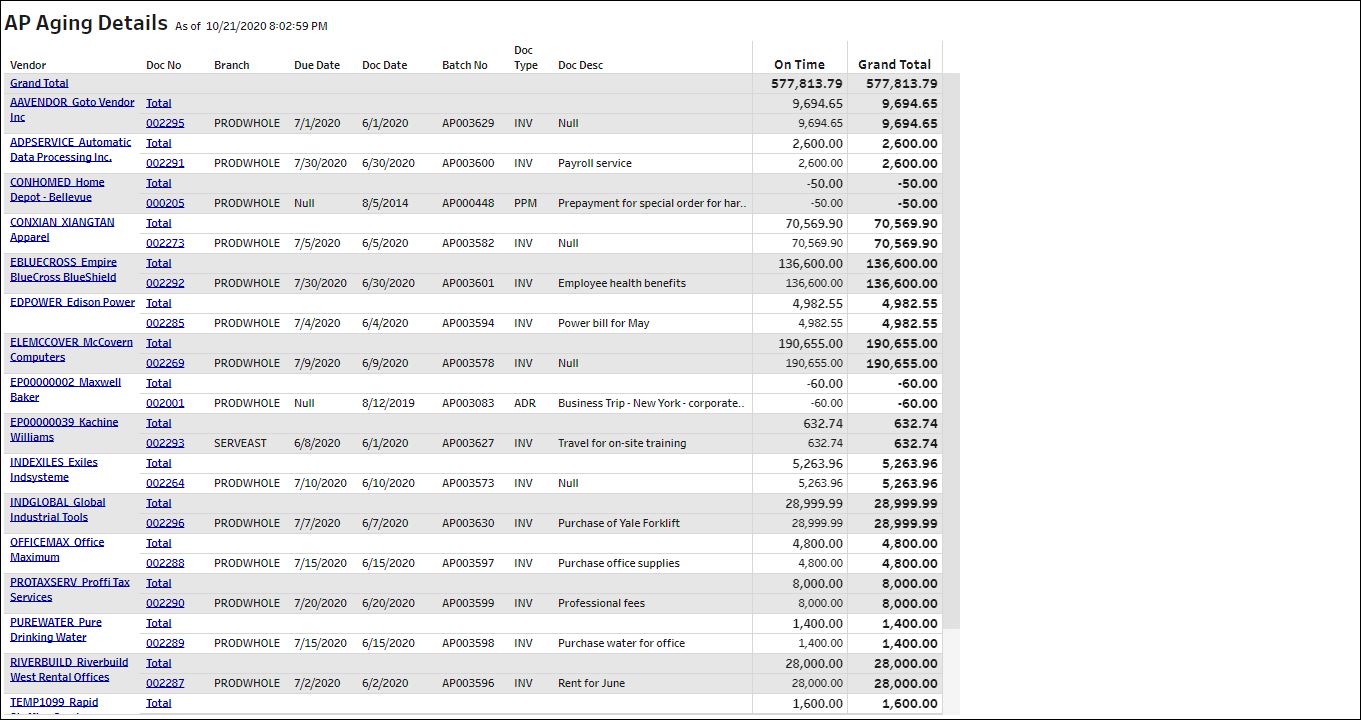
AP Aging
AP Aging Dashboard
AP Details
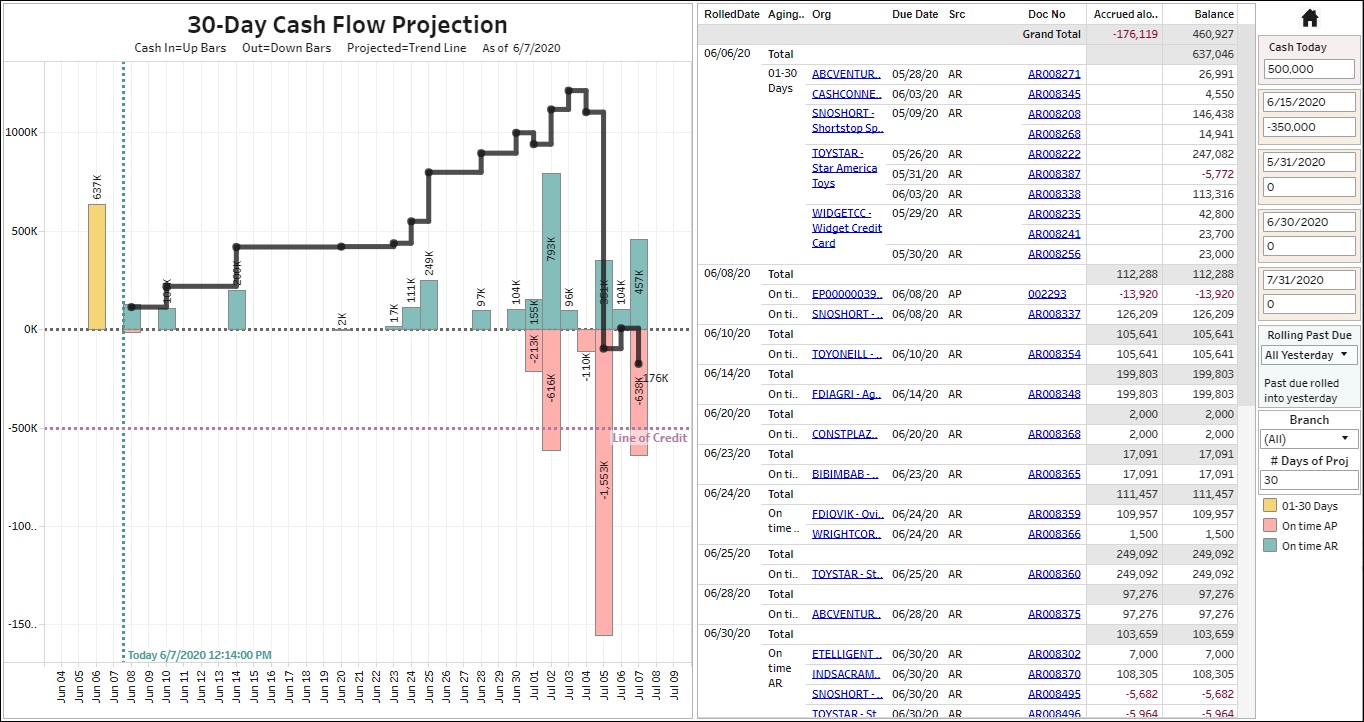
Cash Flow Projection
Cash Flow Projection
Financials
The current Financial templates are designed to complement (not replace) full blown P&L and Balance Sheet reporting. Consult us to discuss how DataSelf Enterprise can improve and replace your full blown financial reporting.
Financial Dashboards
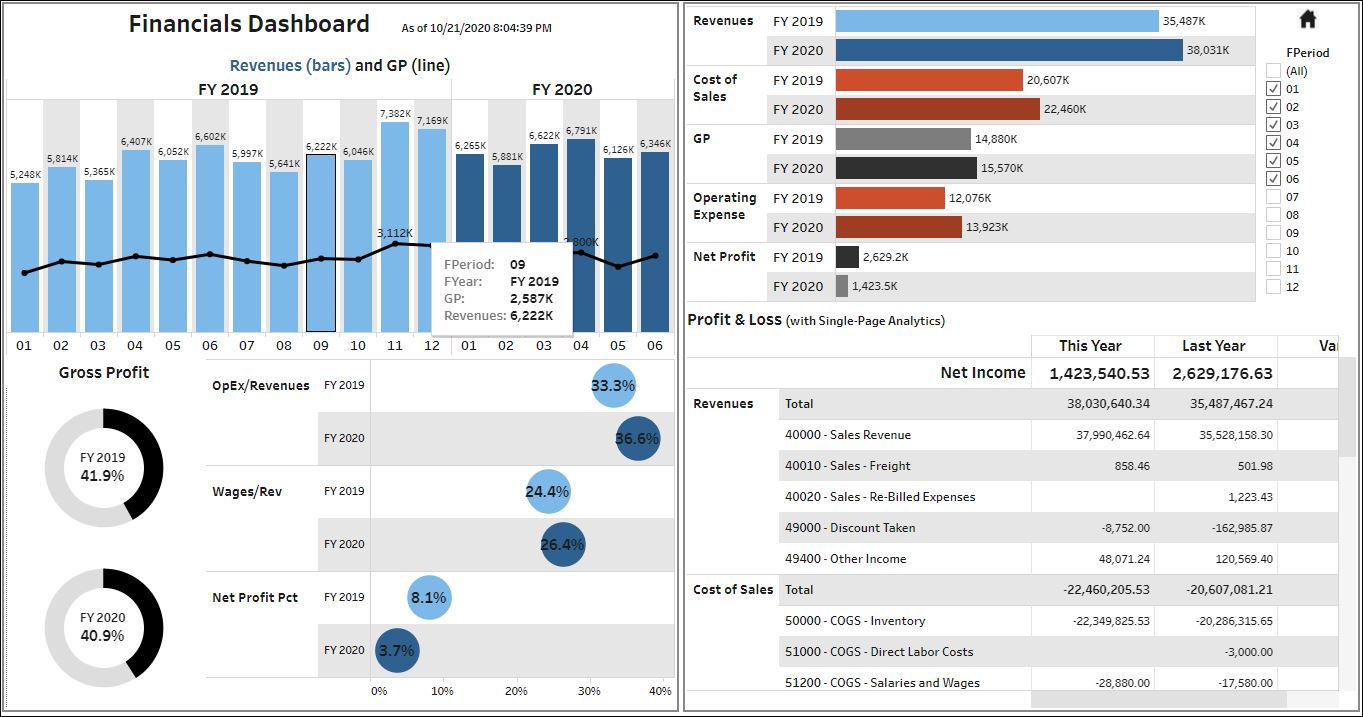
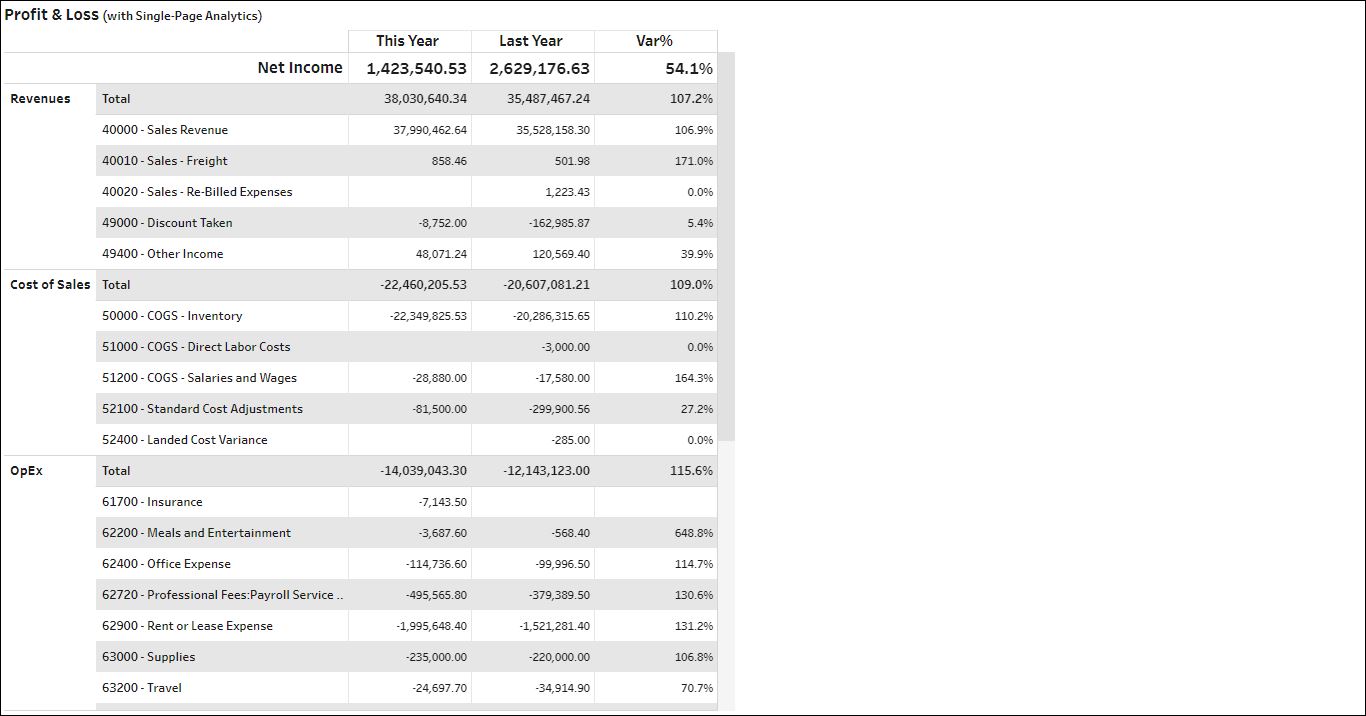
P&L
CRM
Add-On: the CRM templates are optional and usually available as an add-on (additional subscription fee). Please consult us for details.
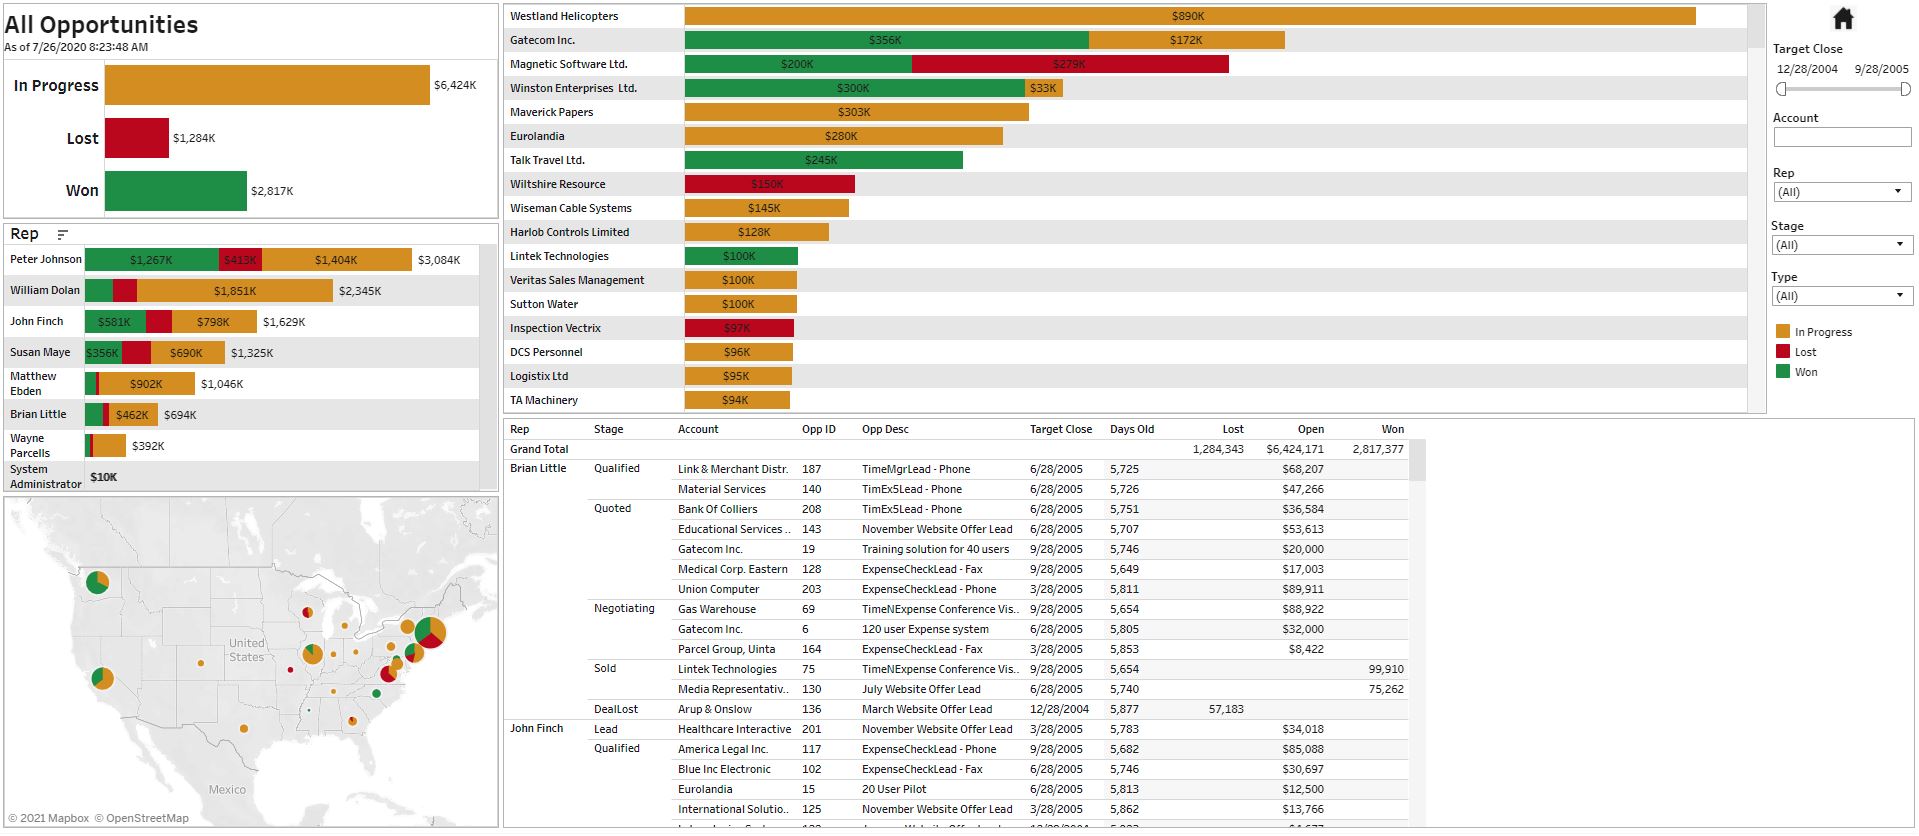
Opportunities
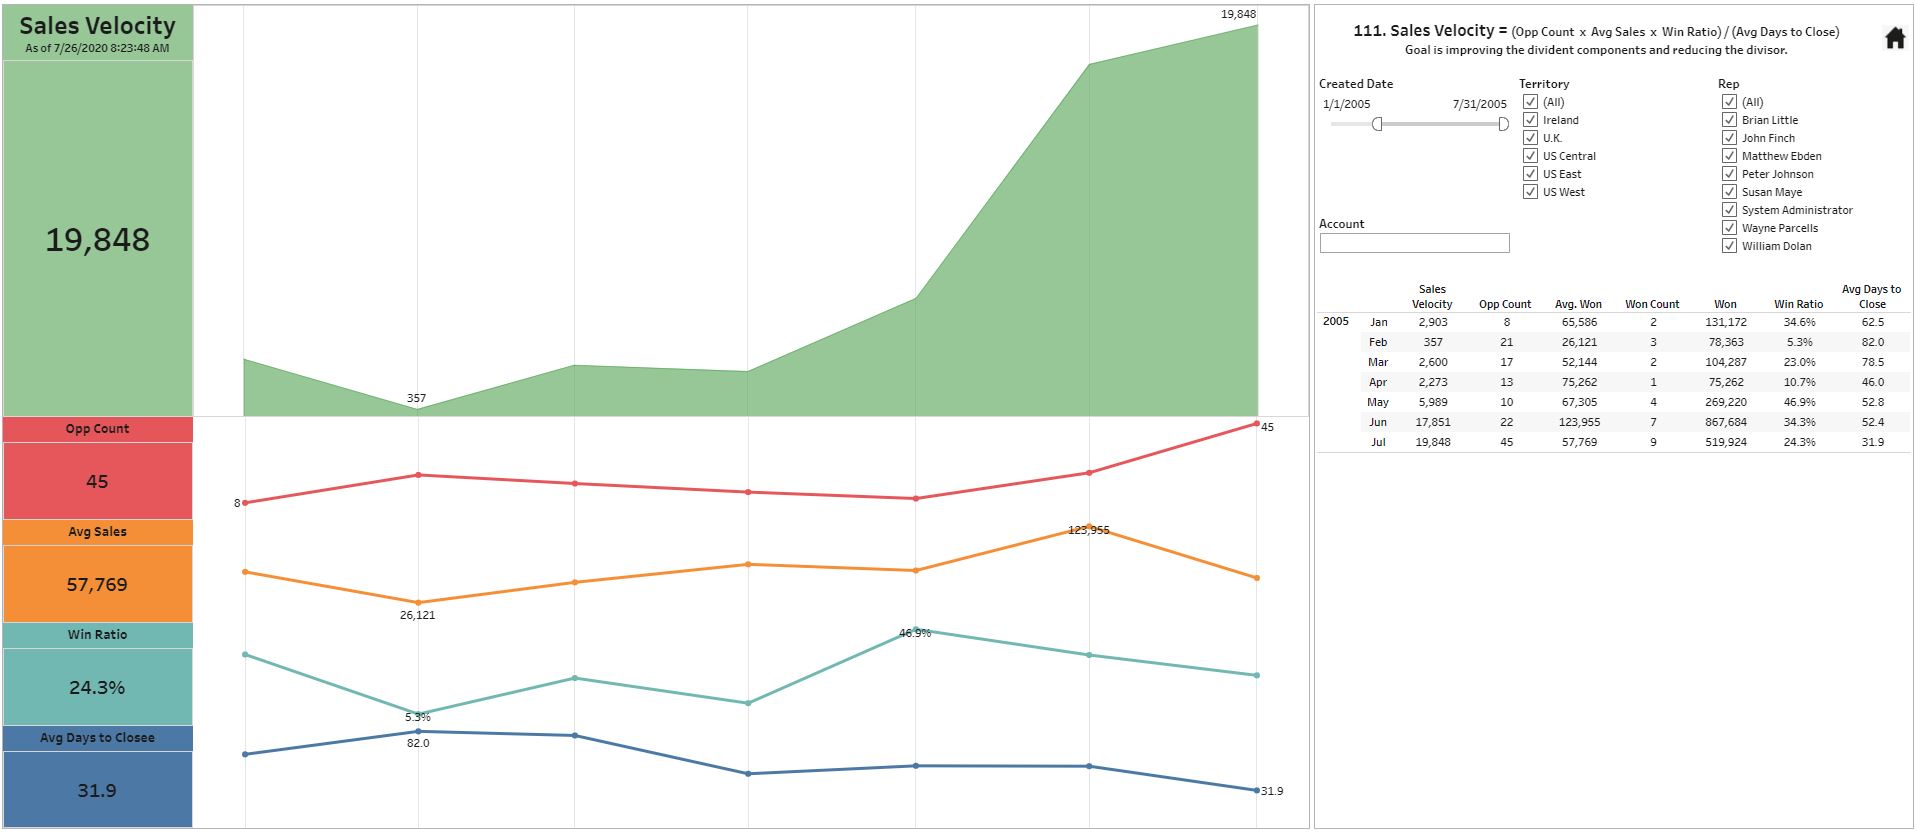
Sales Velocity
A powerful method to analyze the efficiency of your sales processes and team.
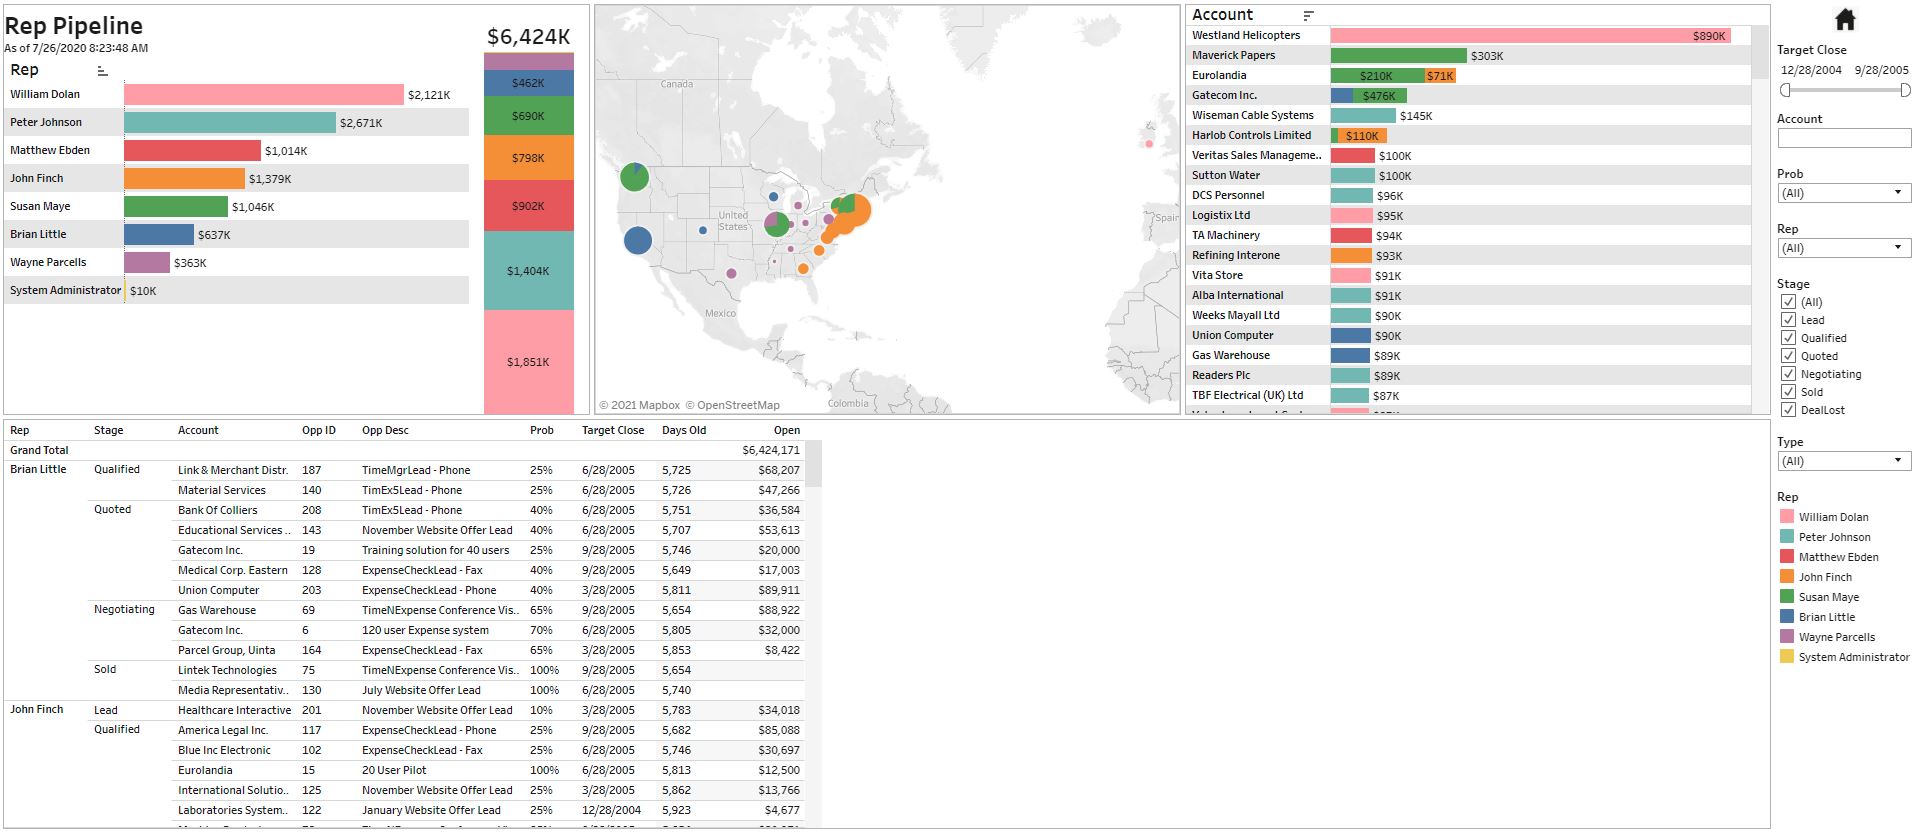
Pipeline
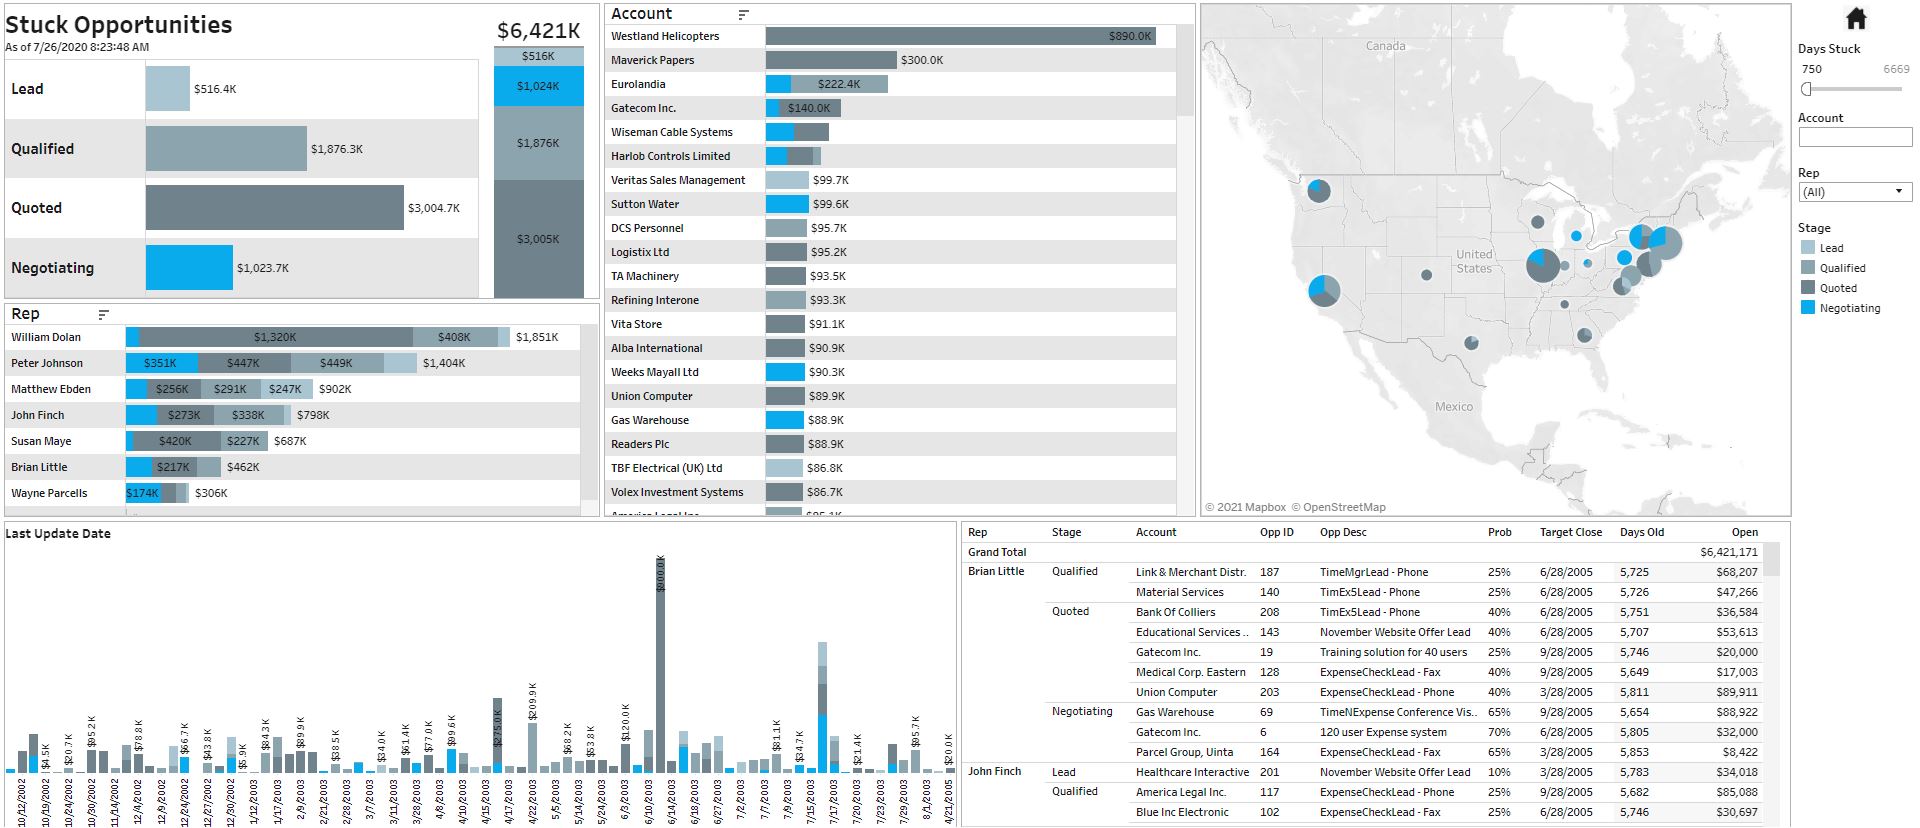
Stuck Opportunities
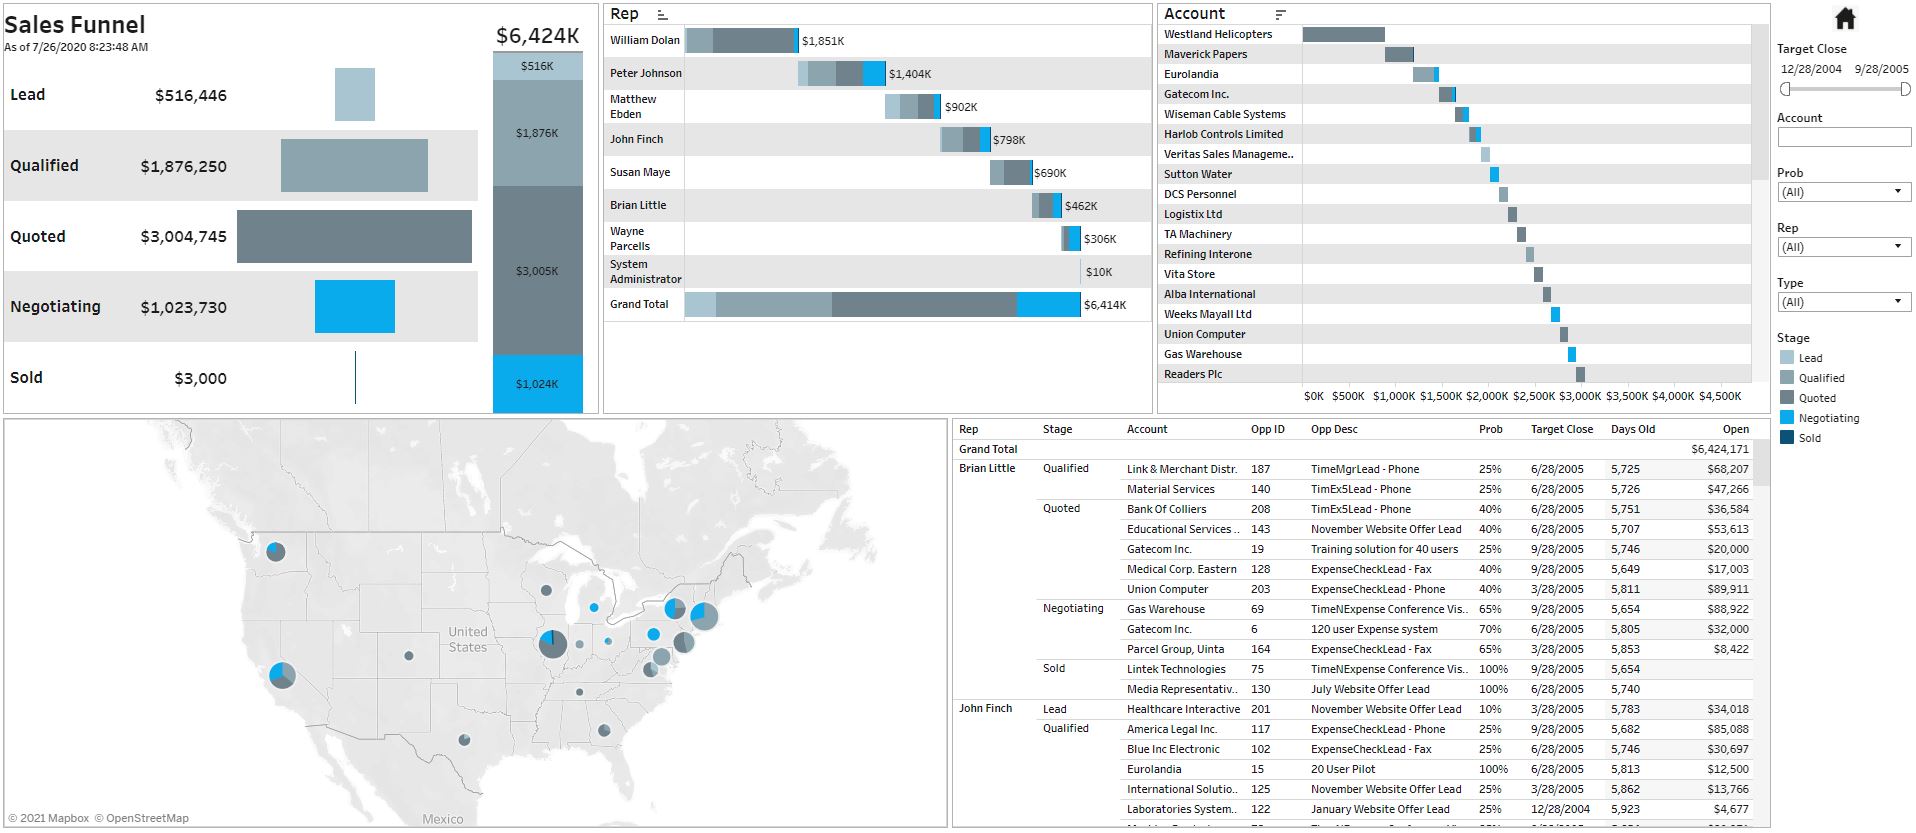
Sales Funnel
Activities
Easily monitor calls, emails, visits, demos and etc by account manager, prospect and opportunities.
Marketing Emails
Add-On: the Marketing Emails templates are optional and usually available as an add-on (additional subscription fee). Please consult us for details.
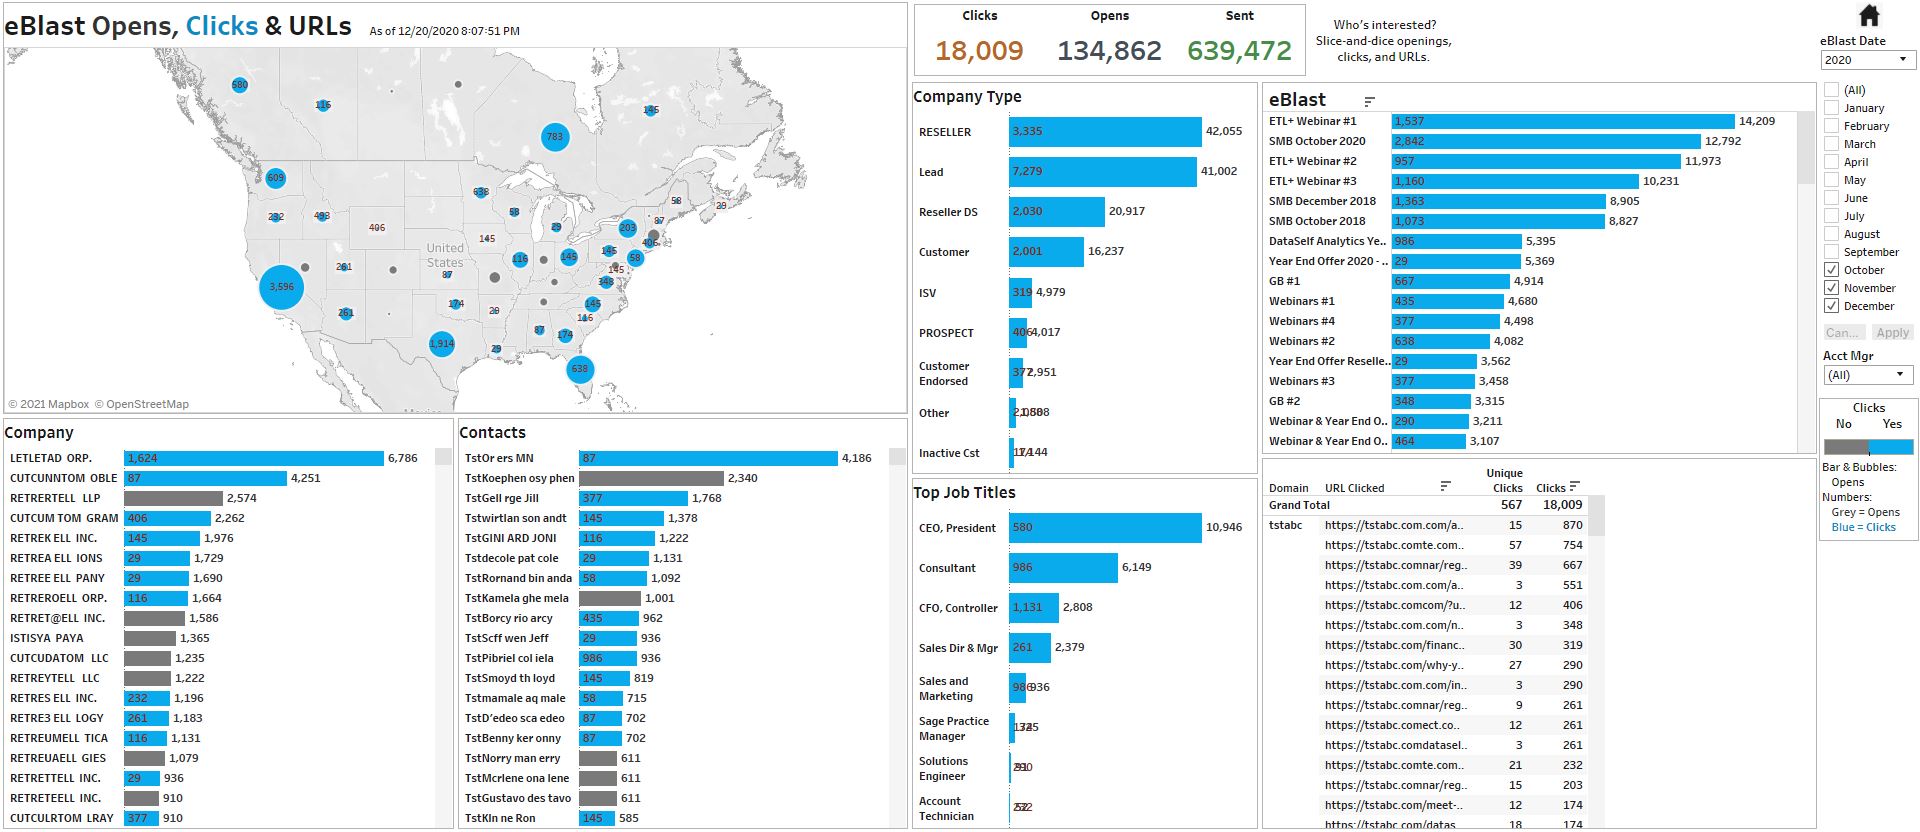
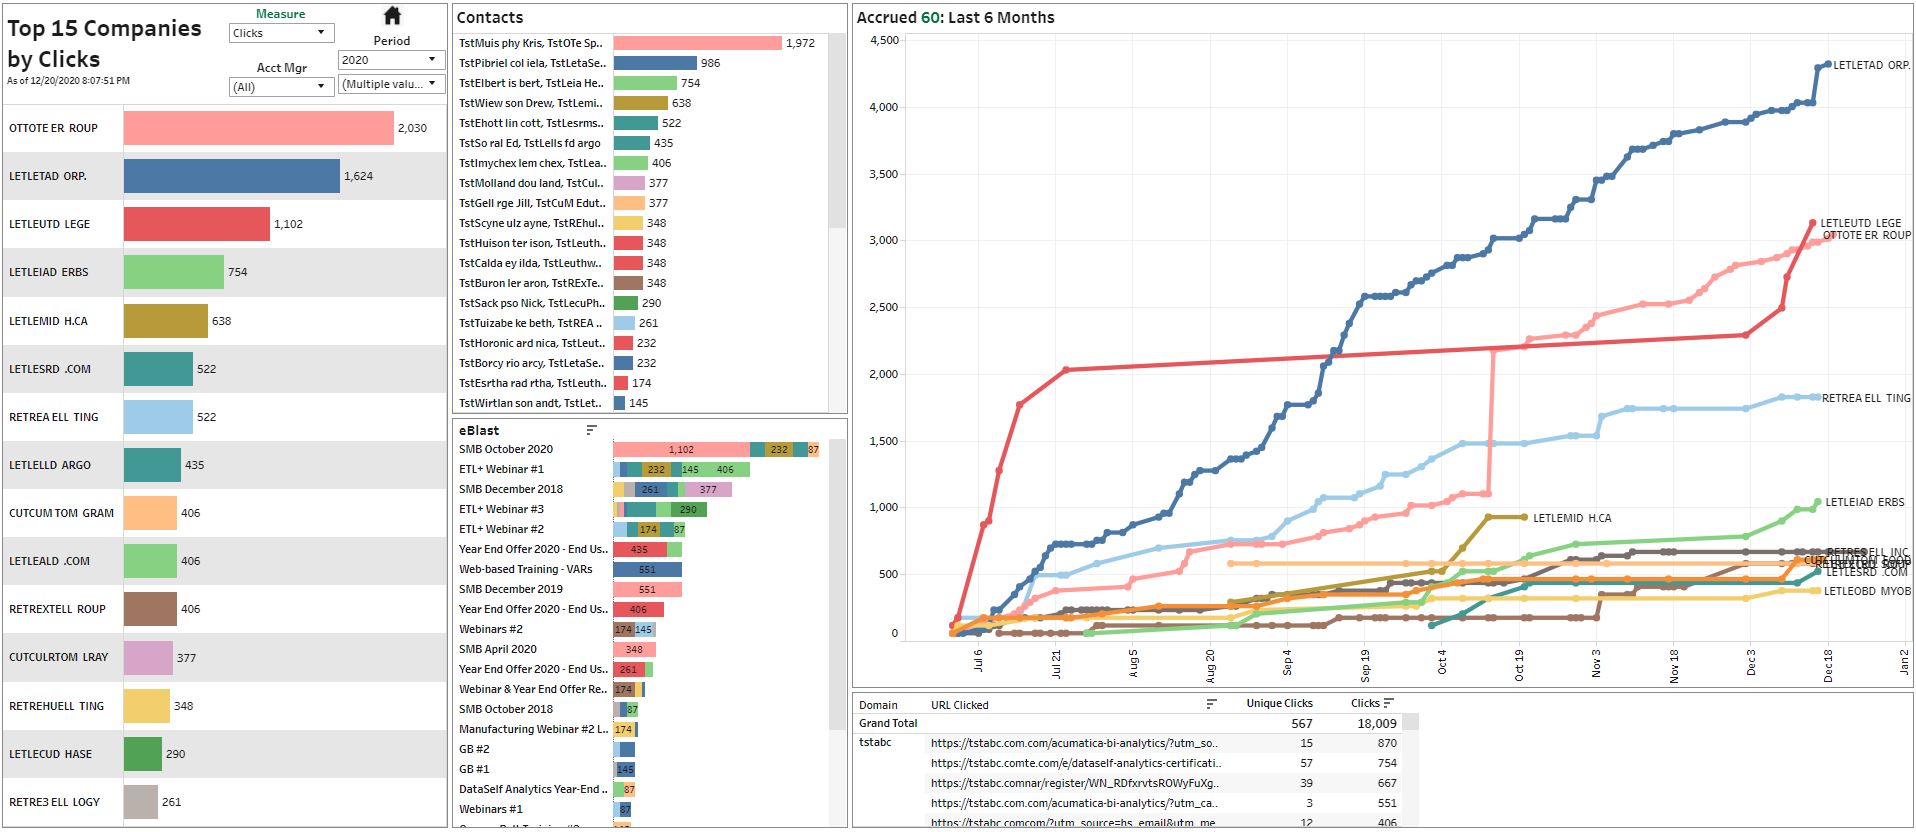
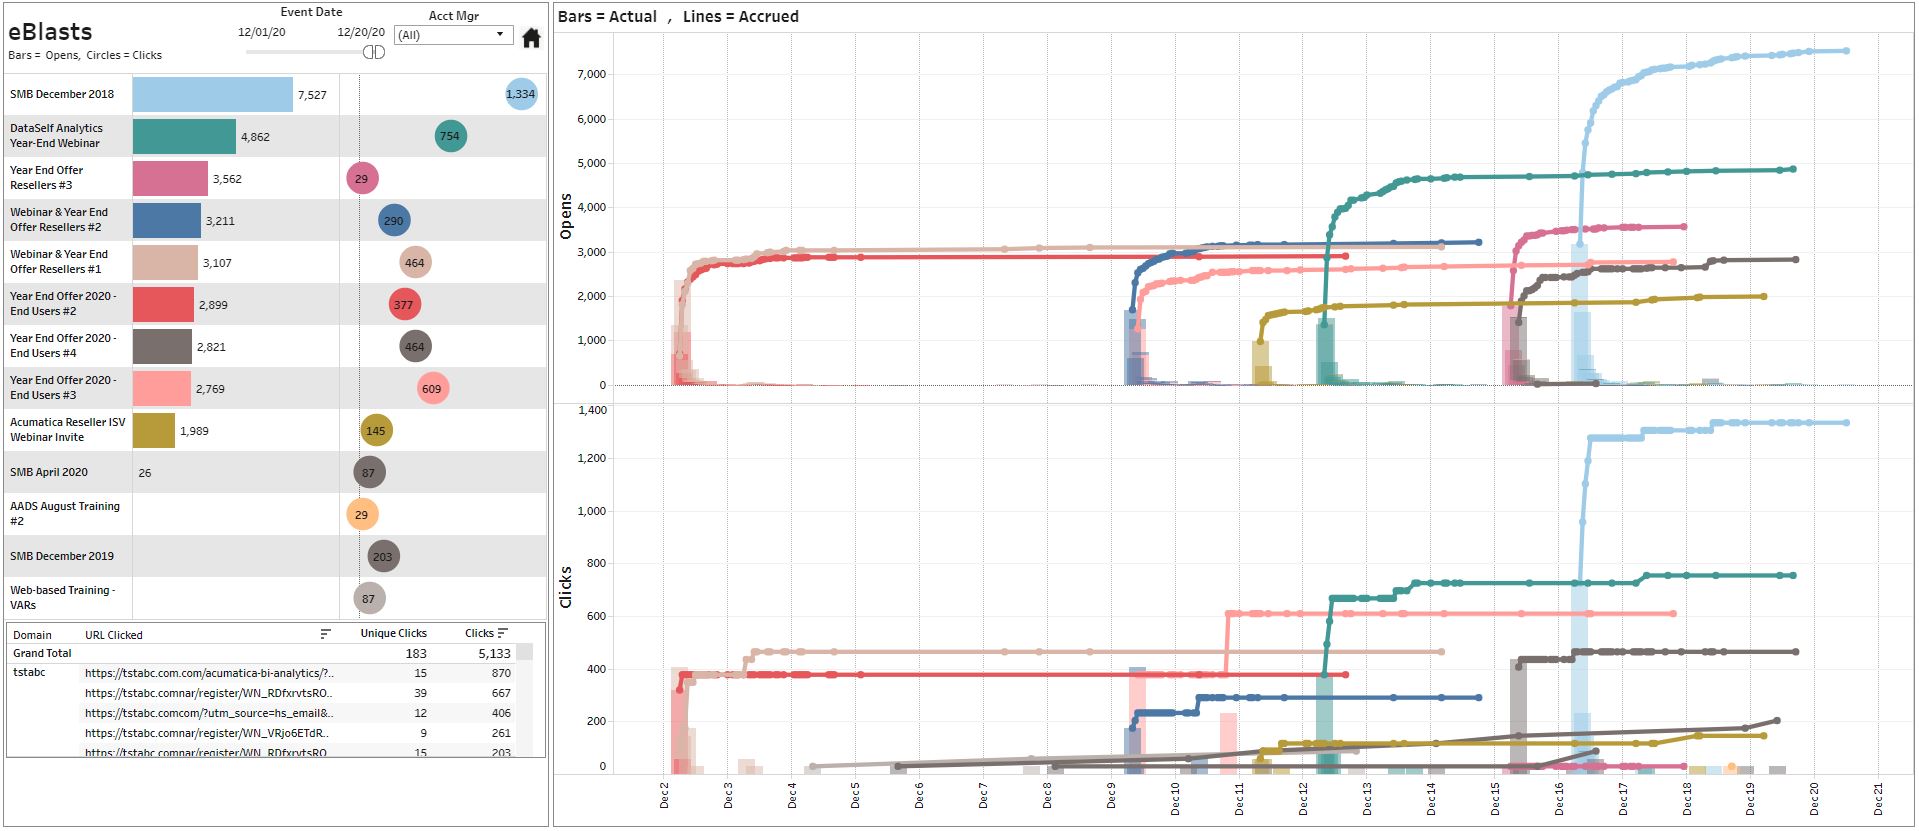
E-blast Opens, Clicks & URLs
Easy and interactive ways to analyze which companies and individuals have been interacting with your marketing emails across marketing campaigns.
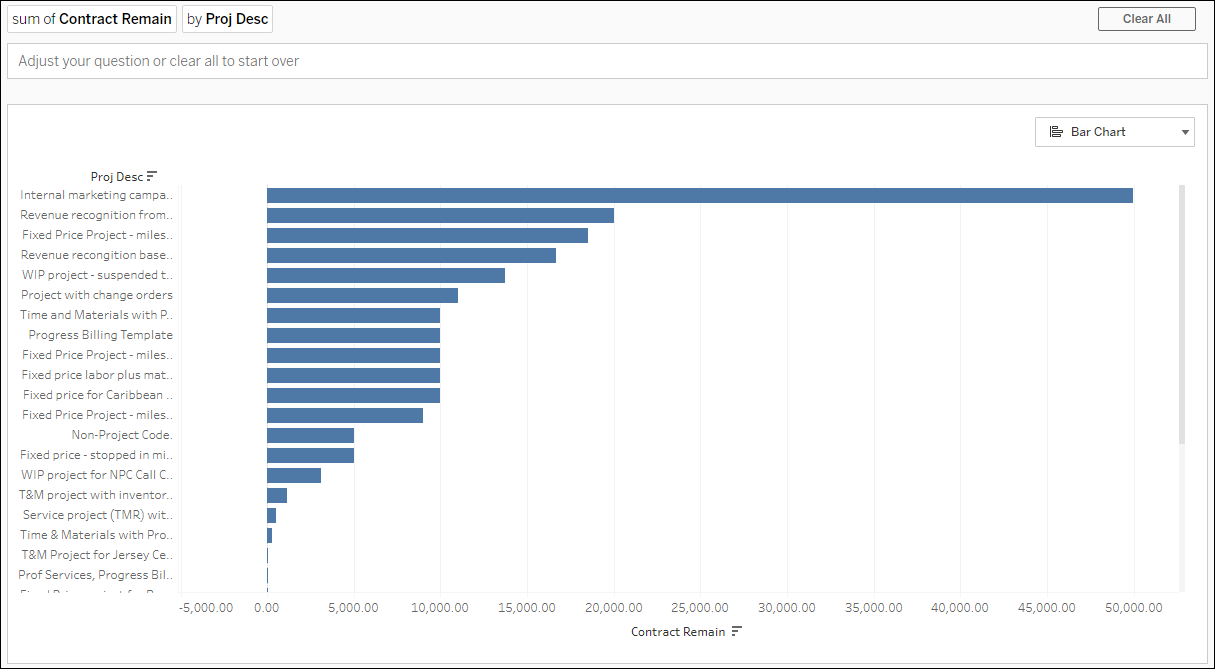
Natural Language Query (NLQ)
Like searching on the internet, type in keywords about your data in DataSelf and an instant and accurate report is created. This is available for each data set in DataSelf and might require additional configuration to meet your company’s needs.
Examples of searches and the report created.
Searching for “Contract Remain Amt by Project” yields:
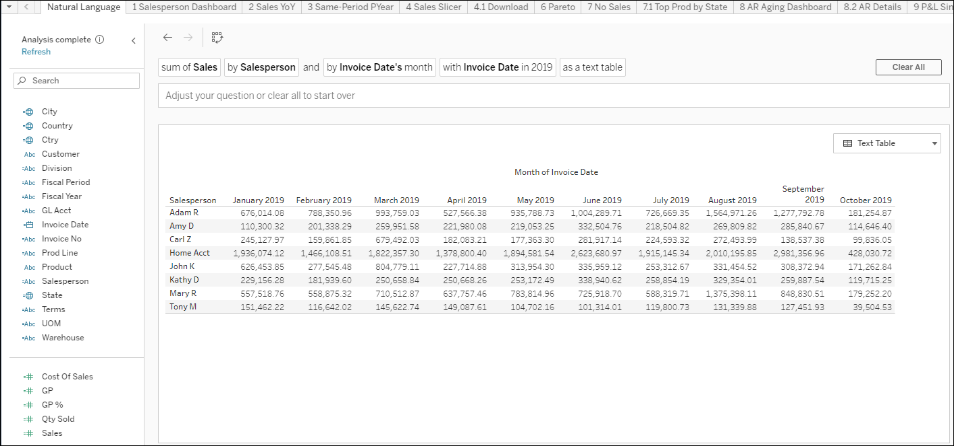
Searching “Sales by Salesperson by Month in 2019 as a text table” yields:
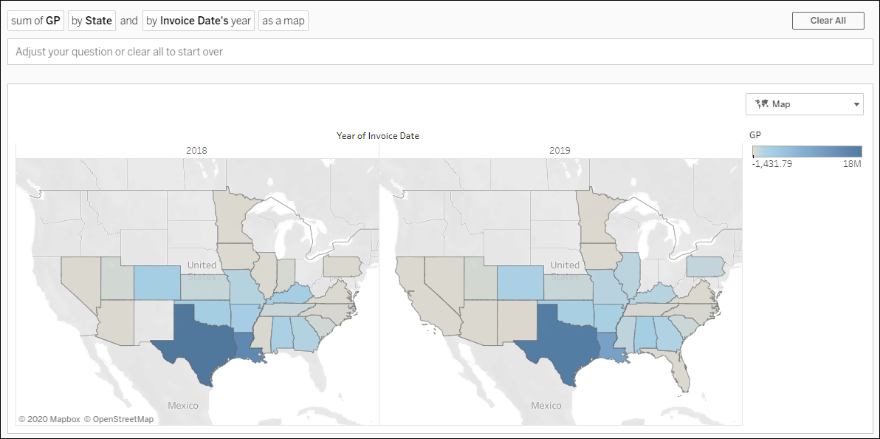
Searching for “Gross Profit by State by Year as a Map” yields:
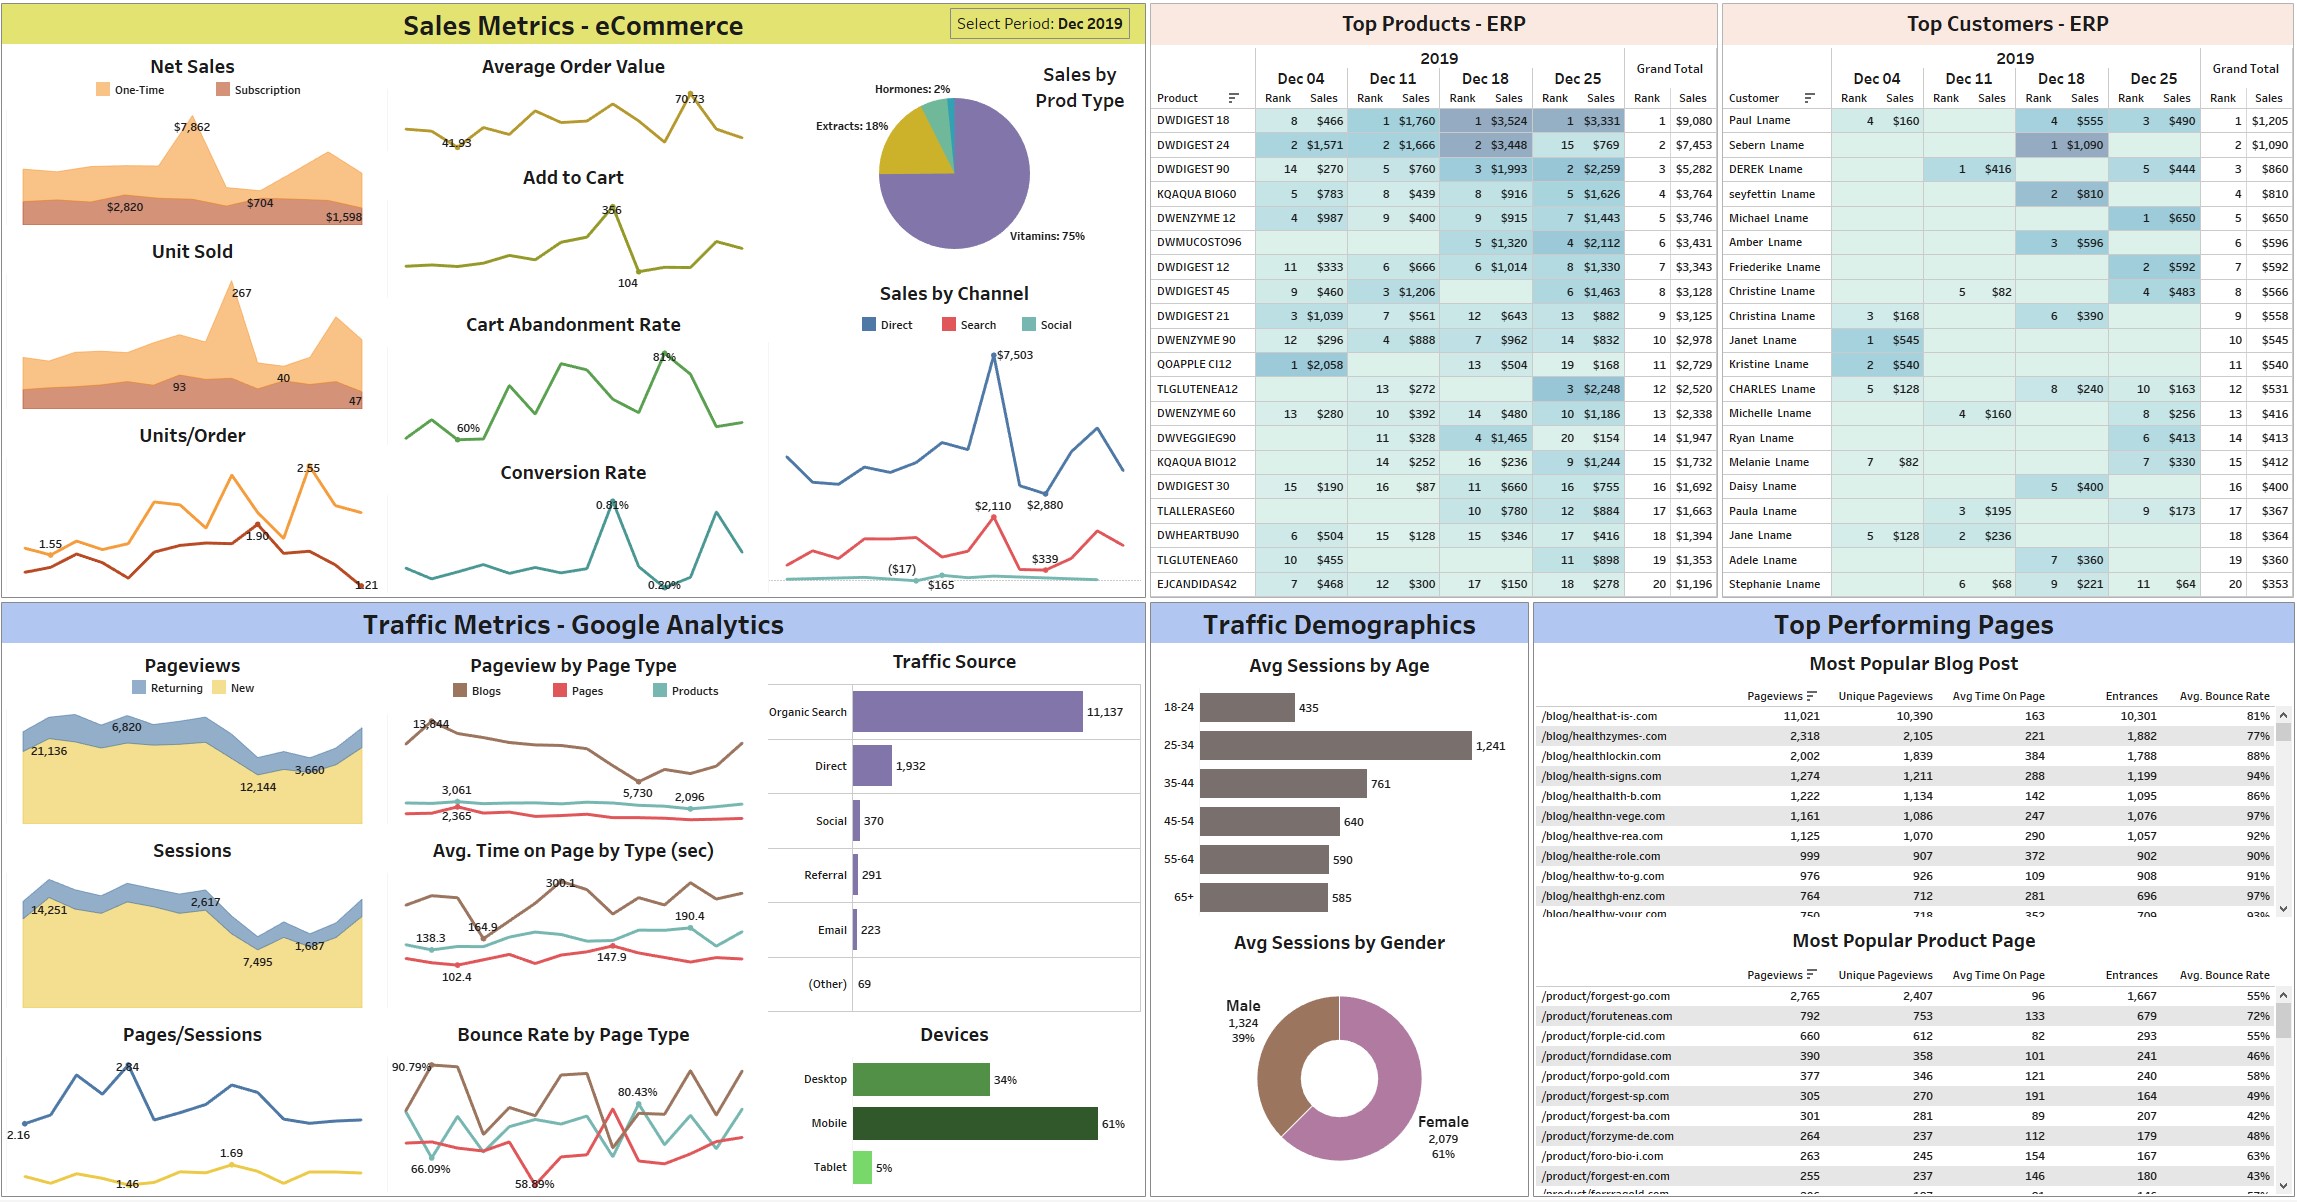
Google Analytics and E-Commerce
Add-On: these templates are optional and available as an add-on (additional subscription fee). Please consult us for details.
These templates have a wide range of configuration possibilities to adapt to unique business needs. Actual templates might vary. Some might
require additional configuration not included in the SOW.
Actual dashboards might be slightly different.
All dashboards above are also included with Enterprise Analytics by DataSelf.
Contact our Distribution BI Experts!
Call 888-910-9802 x1 or email Sales @ DataSelf.com