Manufacturing Dashboards – Samples
Interactive and insightful manufactoring dashboards for every situation.
DataSelf Analytics for Manufacturing provides dashboard views that are easy to configure so you see your data your way. From any dashboard, you can go to the underlying ERP data with just one click.
Advanced Analytics by DataSelf
Manufacturing Edition
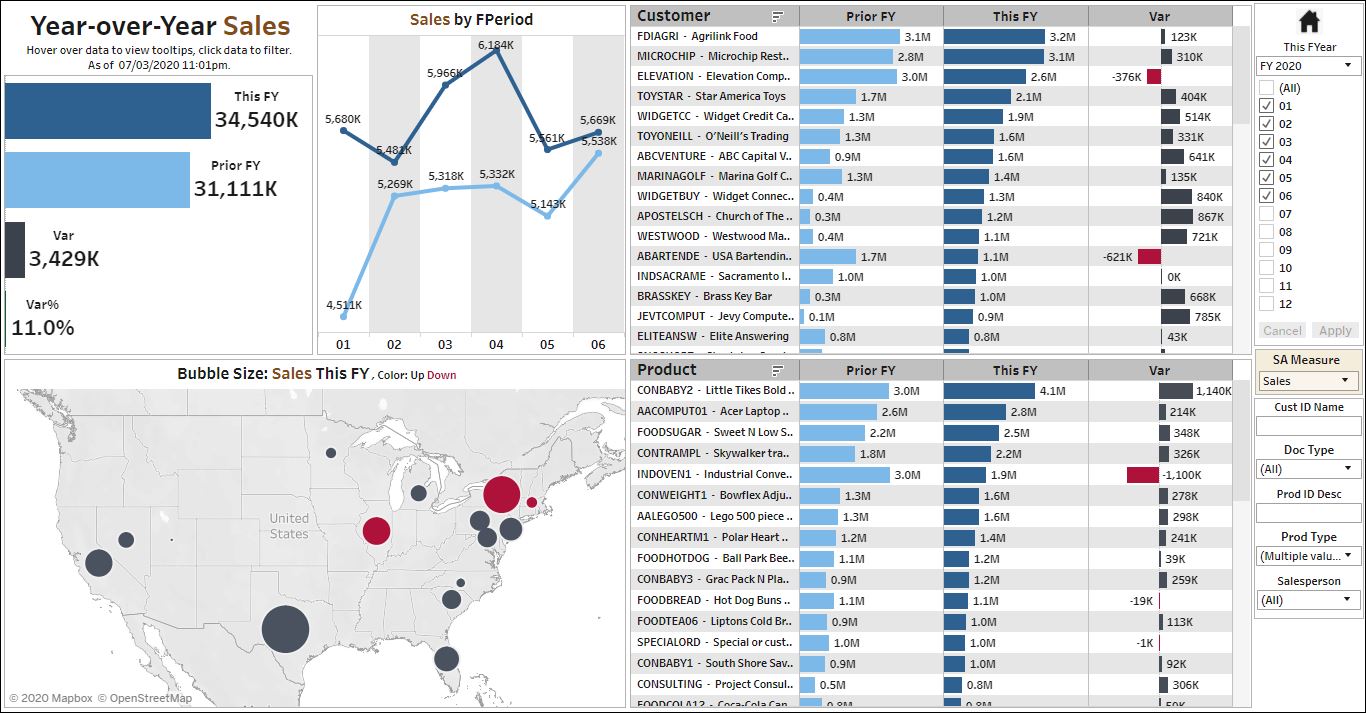
Year-Over-Year
Easy and extensive ways to slice and dice sales information
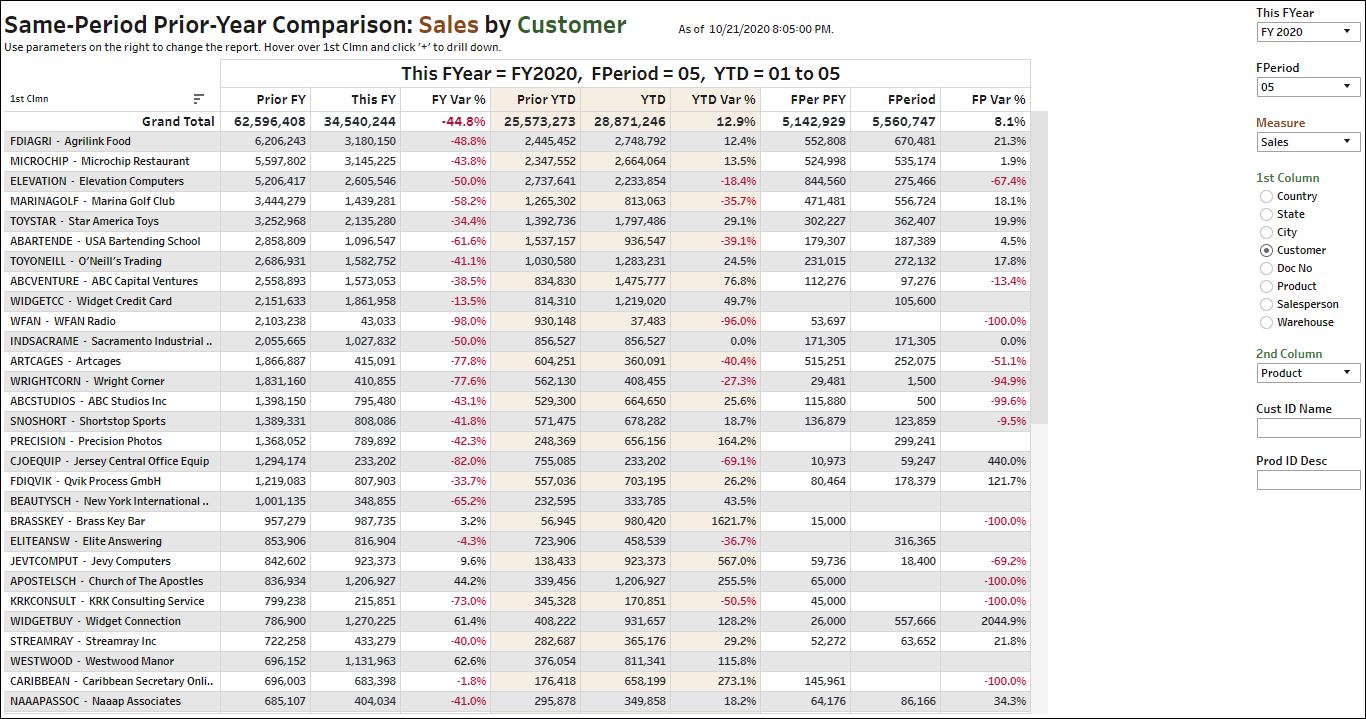
Same-Period Prior-Year Comparison
Choose a year and period, and easily analyze how the period, YTD and full years compare to the prior year by different dimension. Allows easy drill down to further dimensions. Ex.: KPIs by customer and project.
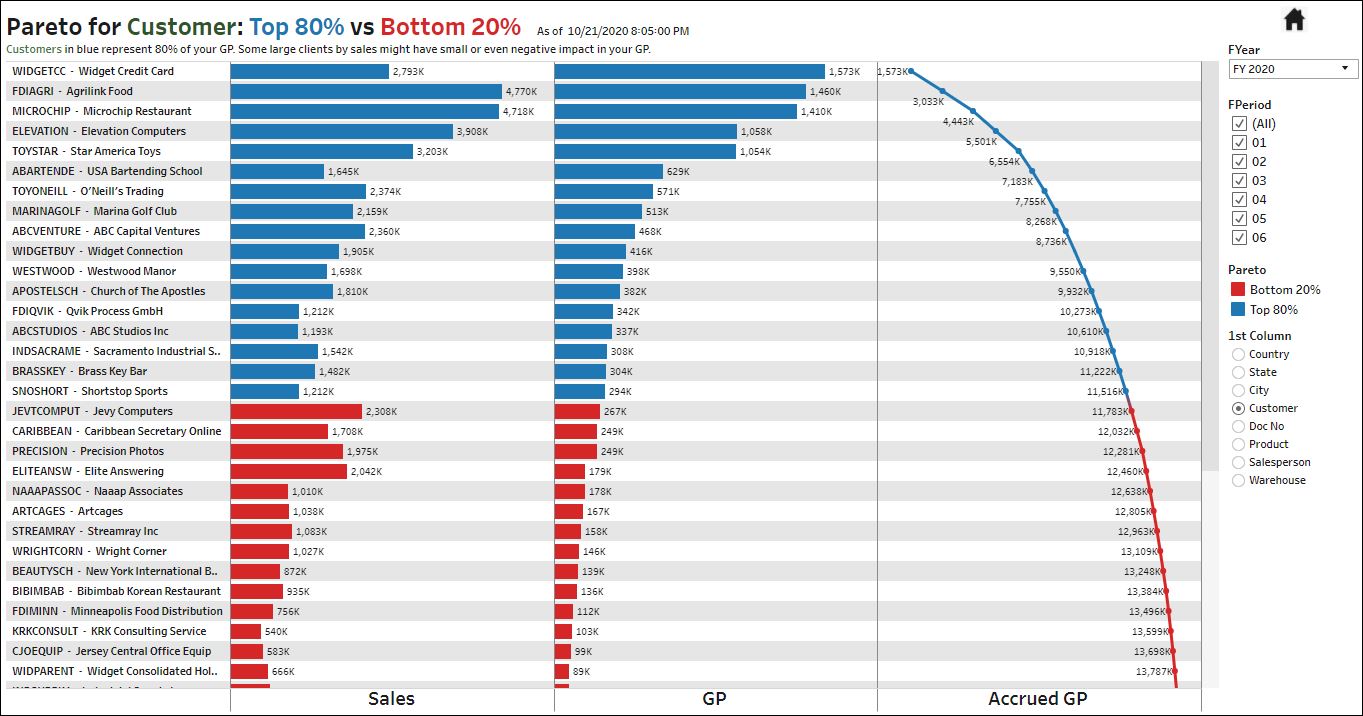
Dual-Measure Pareto
Shows clients, projects and other dimensions affect the bottom line. Should you invest more in some of them, and discontinue others?
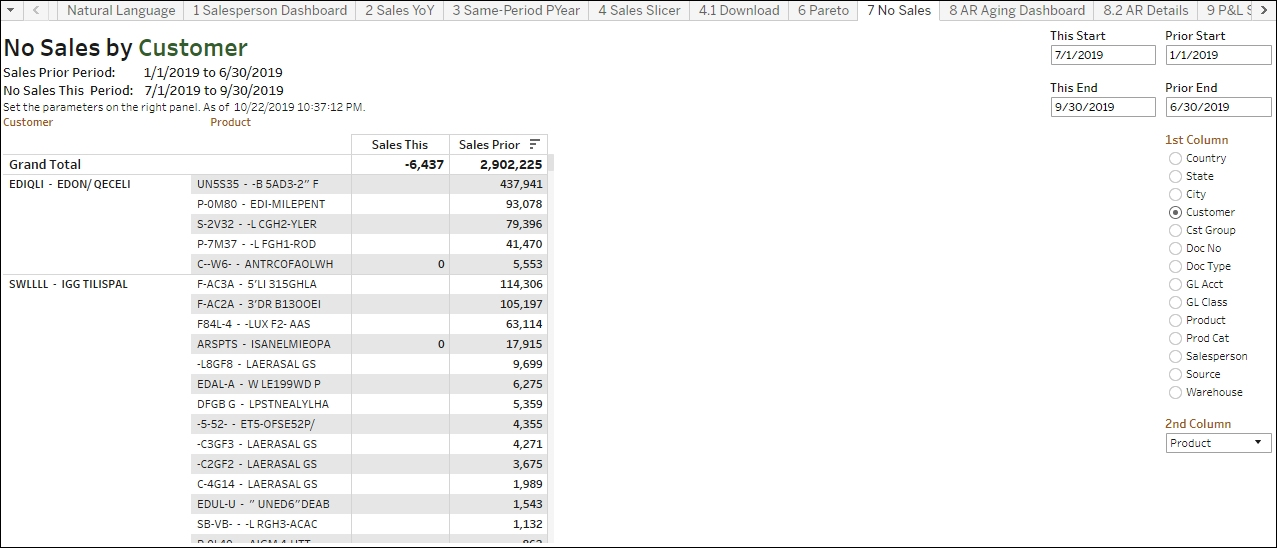
No Sales
Monitoring no new sales quickly can avoid customer friction.
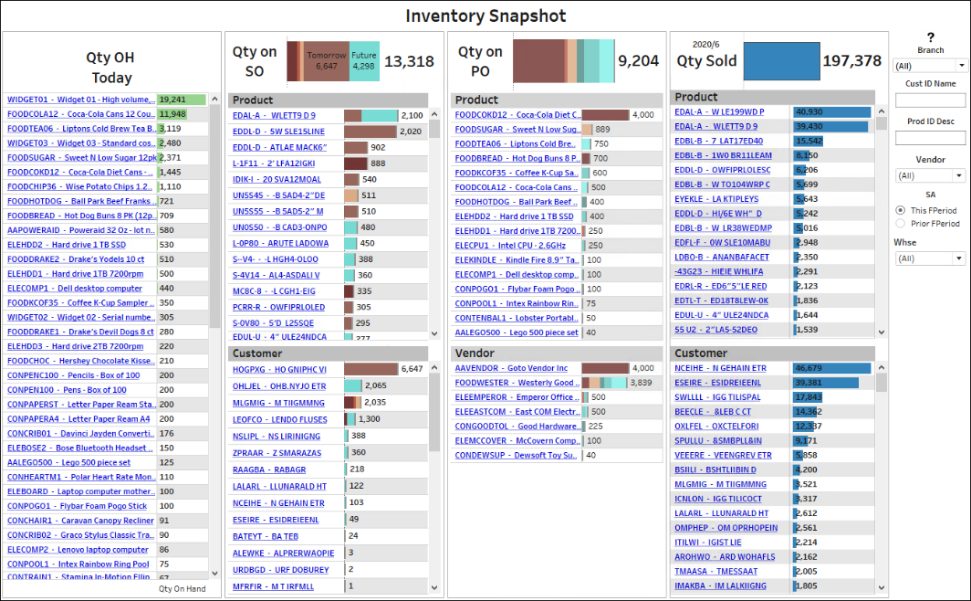
Inventory Snapshot
Easy and interactive analysis of your inventory: On Hand today, Open SOs, Open POs, and Sold.
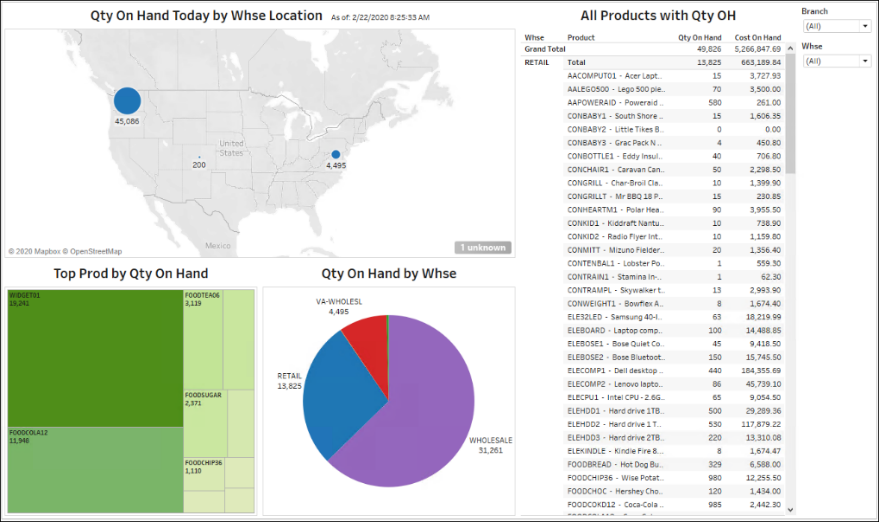
Inventory On Hand Today
Extensive analysis of your On Hand Today.
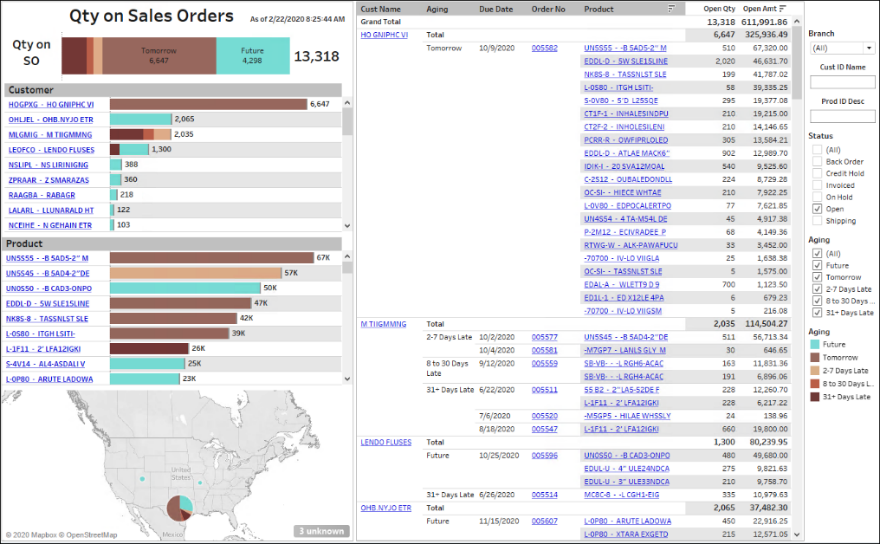
Open Sales Orders
Extensive analysis of your Sales Orders.
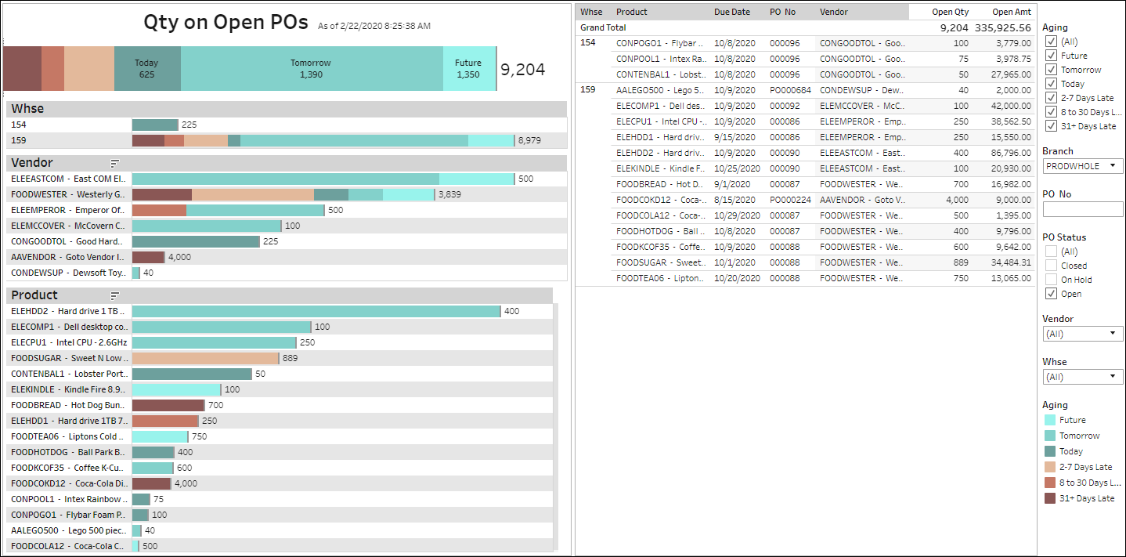
Open Purchase Orders
Extensive analysis of your Purchase Orders.
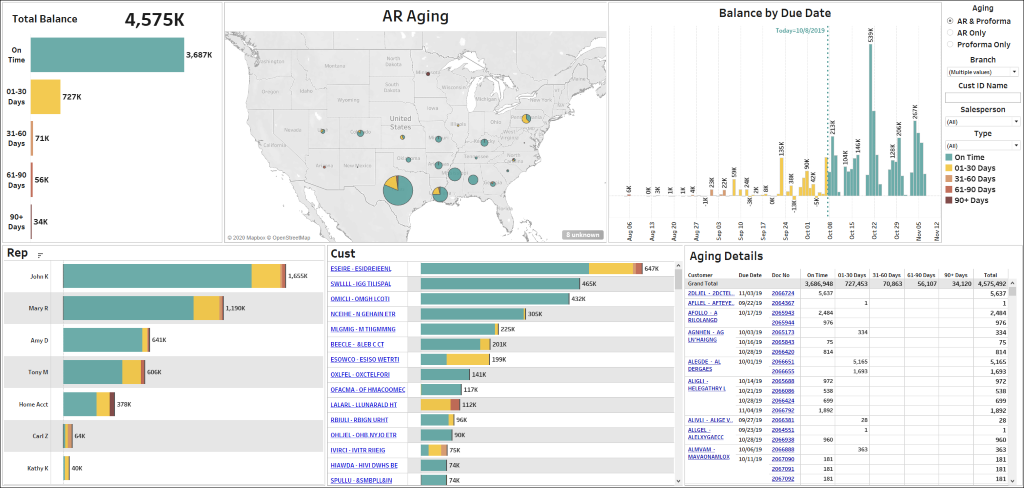
AR Aging (with Proforma – optional)
Easily combine AR Aging with proforma invoices for a more complete view of receivables.
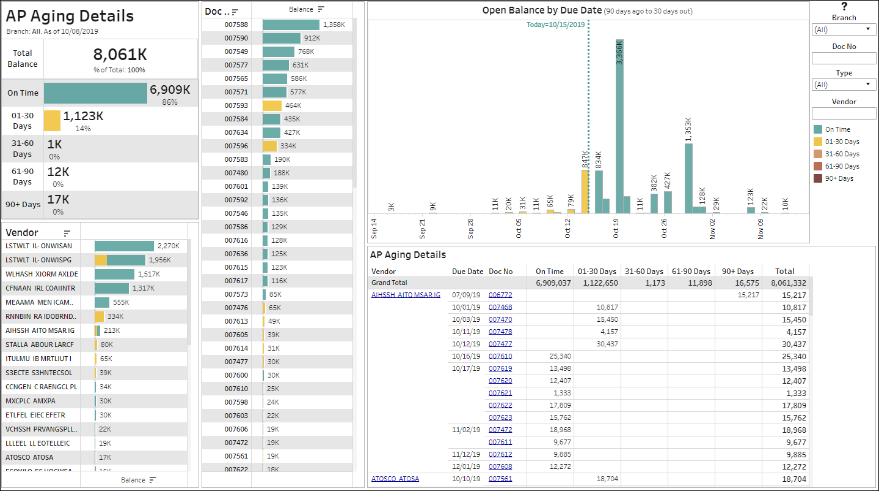
Payables
Hundreds of Payables reports and dashboards allow users to quickly visualize and analyze AP trends. The dashboard below gives an overview of AP by total, vendor, due date, bill and all details. Selecting data points filters the dashboard.
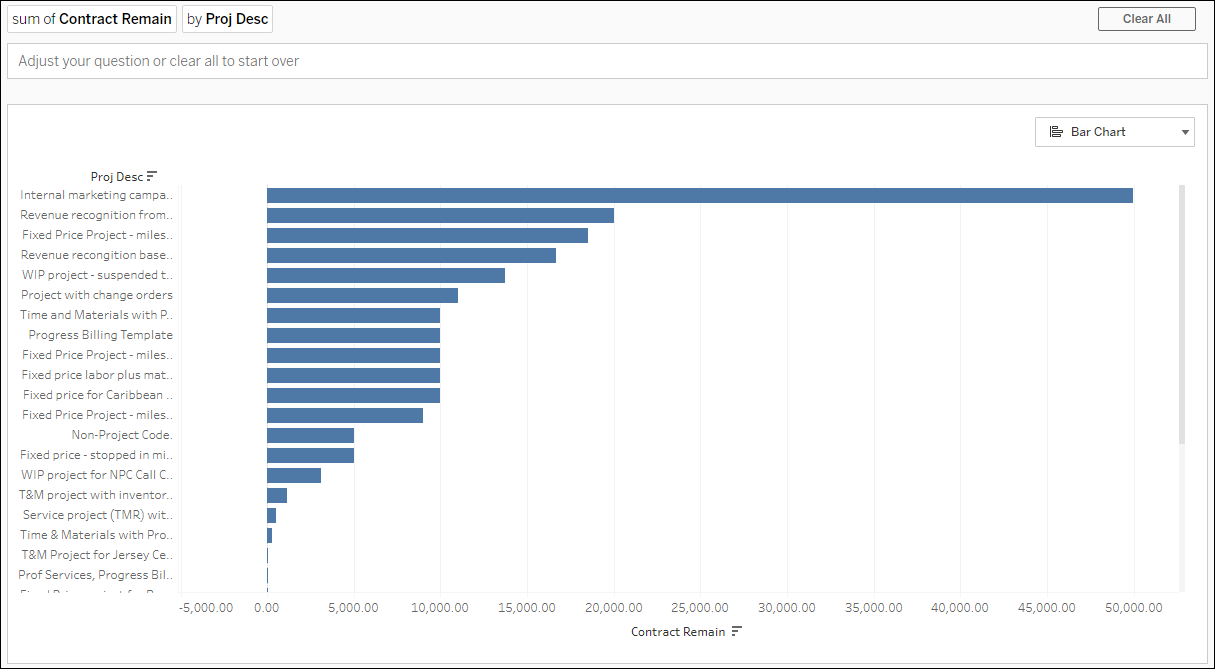
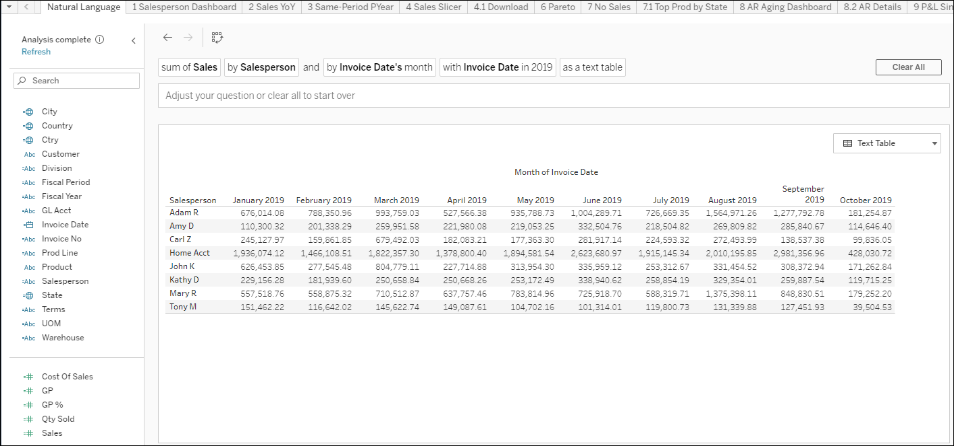
Natural Language Query (NLQ)
Like searching on the internet, type in keywords about your data in DataSelf and an instant and accurate report is created. This is available for each data set in DataSelf and might require additional configuration to meet your company’s needs.
Examples of searches and the report created.
Searching for “Contract Remain Amt by Project” yields:
Searching “Sales by Salesperson by Month in 2019 as a text table” yields:
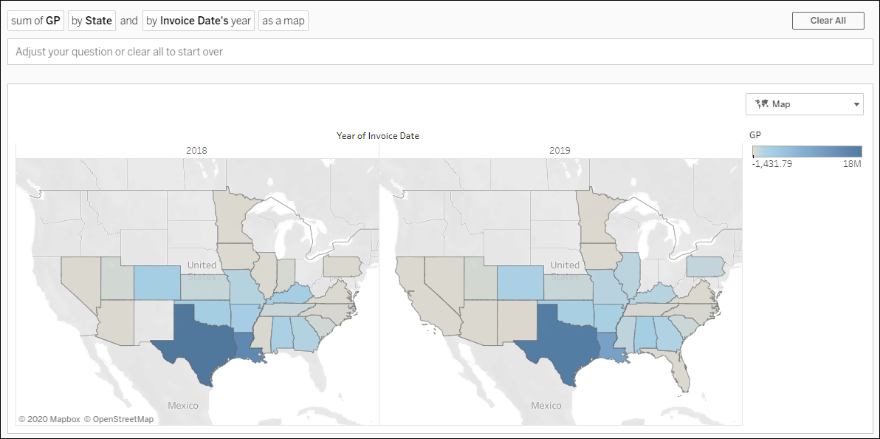
Searching for “Gross Profit by State by Year as a Map” yields:
Actual dashboards might be slightly different.
All dashboards above are also included with Enterprise Analytics by DataSelf.
Easy to customize (Natural Language Query, Tableau, DataSelf ETL+)
Easy and secured access to your data on desktop, web and mobile devices
Dozens of reports, dashboards and KPIs (Key Performance Indicators)
Automatic distribution of reports
Deploys in minutes
Starts at $299/month
Includes all features from Advanced Analytics
Data warehouse for complex reporting and data silos consolidation
Extensive library of reports, dashboards and KPIs
Runs reports in seconds (no matter your data volume)
Deploys in days
Starts at $1,499/month
Contact our Distribution BI Experts!
Fill out the following form and one of our distribution analytics experts will contact you shortly.