DataSelf Analytics for Distribution Companies
 In distribution, one little slip-up can ruin your entire day…
- Faulty inventory projections cause unfulfilled orders
- Buying from the wrong vendor eats into gross profits
- Underperforming sales reps lose sales
- Overdue shipments go undetected
- Conflicting metrics target the wrong markets
- Inaccurate cash flow projections eat up your line of credit
Beyond these challenges, organizations often find themselves in ‘Excel Hell’ – with spreadsheets multiplying faster than rabbits. The resulting hundreds of reports and analyses are not only labor-intensive and error-prone, they also present conflicting metrics (no ‘single version of the truth’) and result in a business ‘flying blind” – making decisions based more on guesswork than on consistent metrics.
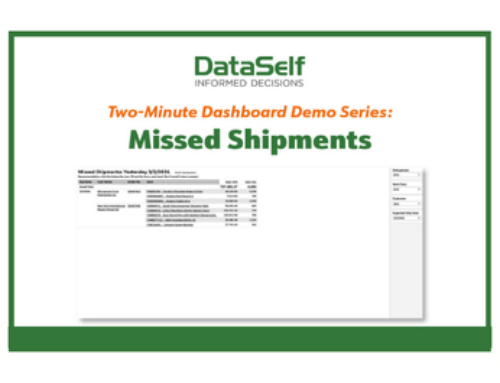
DataSelf addresses issues like these with reports & dashboards specifically tailored to the needs of distributors. With generation in under 10 seconds, auto-delivery options, and unlimited drilldown – how much time could you save? And better yet – how much could you potentially increase your profitability? See them in action with these 2-minute dashboard demos for:
- 360-Degree View
- AI-Driven Insights
- All Opportunities
- AP Aging
- Cash Flow Projection
- Cold Customers by Revenues
- Customer Loyalty
- Customer Profitability / Whale Curve
- Customer Revenues Ranking
- Daily Flash: Sales
- Days of Stock
- eCommerce
- Financials
- Google Analytics
- High-Risk Debt Customers
- Historical Data Loss
- Hot Customers by Revenues
- Interactive P&L
- Inventory Planning & Projection
- Inventory Turnover
- Items by Warehouse
- Missed Shipments
- Pareto
- Purchase Orders
- Rolling-Period Variances
- Sales Funnel
- Sales Orders Late & Pending
- Sales Slicer
- Sales Team Activities
- Sales Velocity
- Salesperson Performance
- Same-Period Variances
- Slow Moving Items
- Stuck Items
- Stuck Opportunities
- Top Items to Top Customers
- Year-Over-Year Variances