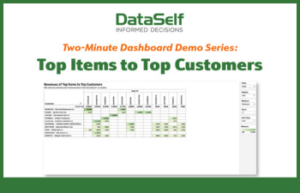
Dashboard Spotlight: Identify Hidden Sales Opportunities via the Top Customers vs. Top Items Report
 Focus: Top Selling Items & Top Buying Customers
For most sales organizations, the expectation is that your top-buying customers are purchasing your best-selling items. But that’s not always the case, and by cross-referencing both of these data sets (top items & top customers), you can highlight sales opportunities that might not present themselves on standard sales reports.
The Revenues of Top Items to Top Sellers report does this cross-referencing for you. It not only identifies previously-undetected sales opportunities, it also instantly highlights which of your best customers are buying more (or less) of your most popular items.
The top business insights provided by this report include:
- . . . which top clients aren’t buying your top-selling items
- . . . which clients (in similar industries) aren’t buying your top sellers
- . . . which clients are buying less-than-expected quantities of your top sellers
- . . . which clients are buying more-than-expected quantities of your top sellers
- . . . comparisons of top buyers (& items) from one time range to another
- . . . comparisons of top buyers (& items) by quantity sold
- . . . comparisons of top buyers (& items) by cost-of-goods sold and gross profit
- . . . what type of items sell the most to your top clients
The report includes the following components:
KPIs: revenues, COGS, qty ordered, gross profits
Totaled by: item, client
Selectable by: time period, item class, top ‘x’ selling clients & items
Timeframe: fiscal year, fiscal month, item type