The SMB Analytics Wire – March 2026
How BI Evolved from No Code Promises to Full Spectrum AI-assisted Power
 With the growth of self-service BI, the technical requirements of business intelligence changed. Businesses began to desire a BI architecture that supported all of their varying degrees of technical aptitude – including an expected growth of their own technical expertise. Critically, the range of BI coding options needed to not be a rigid ‘either/or’ (as in “it either supports coding or it doesn’t”), but rather a sliding scale that equally-well supported “no coding”, “some coding”, and “full coding” options.
The good news is these have now been enhanced by AI-assisted development and automation – making them easier than ever.
Reinventing Business Intelligence for the Next Generation
 In today’s data-driven world, many organizations struggle to turn raw data into trusted insights quickly and efficiently. Traditional BI tools like Power BI, Tableau, and Excel help to visualize trends and highlight anomalies, but problems persist — inconsistent data, unreliable metrics, and lengthy deployments being the most common.
Next-generation business intelligence is based on automation and AI across the entire analytics stack. The latest innovations take a multi-tiered approach to fundamentally reimagine how companies connect data to decisions.
- Data – Cleansed & Optimized
- Modeling – Automated
- KPI Libraries – For Specific Apps, Industries, & Roles
- AI Assist – Everywhere
The Next Evolution in Enterprise Reporting: A Galactic View of Your Business Data
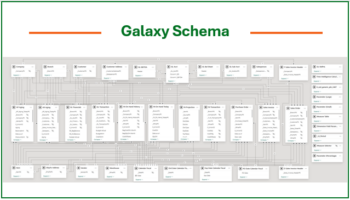 For years, business reporting has revolved around a single “star” — one application, one dataset, one perspective. But today’s organizations operate across ERP, CRM, finance, and more, making single-source reporting increasingly limiting. In this article, we explore the next evolution in enterprise analytics: the Galaxy Schema – a powerful new approach that connects multiple data models to give you a true, cross-enterprise view of your business.
Turbocharge Power BI to Expedite and Simplify Advanced Analytics
 If your Power BI reports and dashboards fall short of your expectations, don’t blame Power BI – because the truth is that it is only one part of a holistic business intelligence initiative.
End-to-end business intelligence requires more than just data visualization. It requires three essential and complementary components:
- Data optimization
- Automated data modeling
- Libraries of preconfigured reports & dashboards with critical KPIs
Supercharge Tableau with Data Optimization, Auto-Modeling & KPI Dashboards
Tableau Is Powerful – But It’s Even Better with Clean Data, Smart Models, and Targeted KPIs.
 Tableau is one of the most powerful data visualization tools on the market. It helps teams see and understand their data, bringing clarity to everything from sales trends to supply chain efficiency. But as many companies quickly learn, data visualization is only part of the Business Intelligence (BI) equation.
If you’ve ever waited for a slow dashboard to load, struggled with inconsistent data, or burned hours manually cleaning up spreadsheets, you’ve experienced the limits of a visualization-only approach.
The truth is simple: Tableau delivers its best performance when complemented with a trio of critical BI foundational solutions:
- ETL data optimization
- Automated data modeling
- A library of preconfigured KPI reports and dashboards
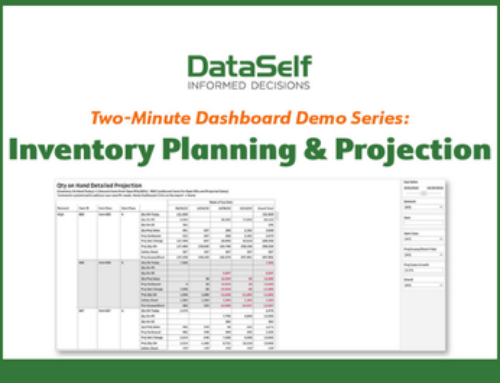
Dashboard Spotlight: Strategic Inventory Planning & Projection
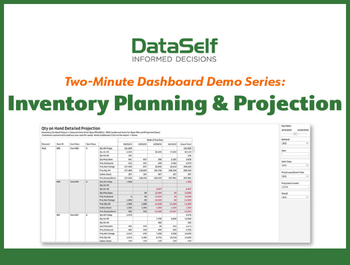 Projecting future inventory needs is a delicate balancing act which is dependent on a sophisticated series of calculations. Starting with an item’s current on-hand quantity, accurate needs projections have to factor in inbound stock (from purchase orders and work orders), outbound stock (including open sales orders and projected sales), and a ‘best guesstimate’ on projected sales growth based on historical performance.
The inventory planning and projection report not only considers all of these factors when forecasting future needs, it also allows you to customize these calculations based on organization-specific factors.
Learn more about this dashboard >>
View the 2-Minute Inventory Planning & Projection Dashboard Demo >>
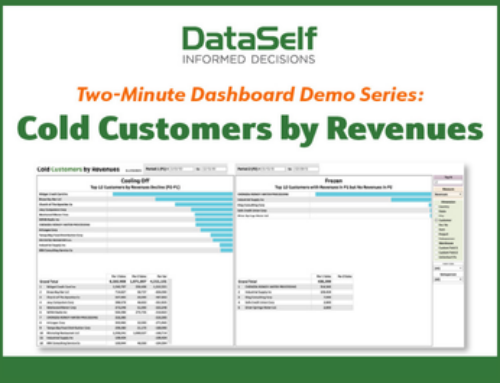
Dashboard Spotlight: Cold Customers Report
How Distribution Companies Identify Underperforming Customers, Items, and Sales Reps
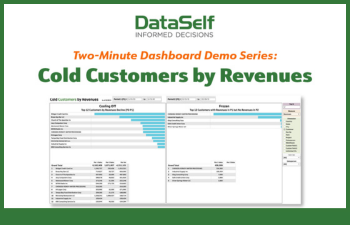 Whether it’s poorly-performing customers, items, or regions, the common theme is the need to know “who (or what) is not performing well”. DataSelf provides this visibility by enabling you to select which subject (or “dimension”, such as customer, item, or region), you wish to report on.
The Cold Customers by Revenues report shows this report for the dimension of “customer”. (You can choose from a pre-configured (and customizable) list of twelve different dimensions on the right side of this report.) The three most popular dimensions are customer, item, and salesperson. Note that although this report defaults to totaling revenues, it may also total gross profits, cost-of-goods sold, and quantity sold.
Top Insights from this Report >>
View Cold Customers by Revenues Dashboard in Action (2-min) >>
Is Your Inventory Working for You?
Calculating Financial Efficiency: The Speed of Stock
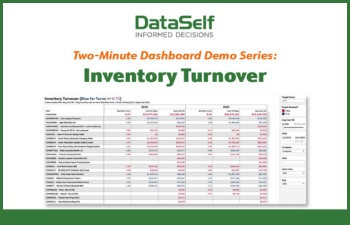 Every business has best sellers – but those “winners” don’t always stay that way.
What flew off the shelf last month may be tying up cash today. Seasonal shifts, changing demand, and evolving customer preferences can quietly turn profitable inventory into costly dead weight.
That’s why understanding the speed of stock – also known as inventory turnover – is critical to financial efficiency.
2026 Events, Demos and Webinars
 We love getting to meet up with clients and businesses at conferences, webinars and everywhere in between! It is more important than ever that executives and managers have access to clean data and accurate reporting to make better, easier, and faster decisions!
Recordings & Resources
- How BI Evolved from No Code Promises, to Full Spectrum AI-assisted Power
- Reinventing Business Intelligence for the Next Generation
- The Next Evolution in Business Reporting: A Galactic View of Your Business Data
- Turbocharge Power BI to Expedite and Simplify Advanced Analytics
- Supercharge Tableau with Data Optimization, Auto-Modeling & KPI Dashboards
- Dashboard Spotlight: Strategic Inventory Planning & Projection
- Dashboard Spotlight: Cold Customers by Revenues
- Dashboard Spotlight: Inventory Turnover
- 2026 Events, Demos and Webinars!