Understanding Business Intelligence: The BI Building Blocks You Need for Next-Generation Analytics
Article Summary:
Implementing business intelligence (BI) is one of the smartest moves a company can make – but BI alone isn’t enough. Many organizations underestimate the cost, time, and complexity of deploying BI tools like Power BI, Tableau, or Looker. The real key to success lies in combining BI with three critical components: data cleansing and optimization through ETL and data warehousing, automated data modeling to rapidly define meaningful metrics, and a rich library of preconfigured reports and dashboards. Together, these elements transform BI from a slow, costly project into a fast, reliable, and insight-driven solution that empowers better decisions across the organization.
 Business intelligence. Some organizations look to implement it because it’s new, cool, and leading edge. Others companies decide they need it because they’re adopting a ‘data-driven culture’. And still other businesses opt for BI simply because they need more sophisticated analytics.
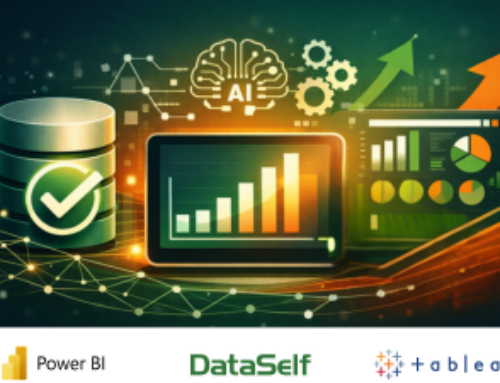
There are a wealth of proven technologies to choose from. They include:
- Tableau™
- MS Power BI™
- Looker™
- Qlik™
- MS Fabric™
- (and more)
As with many such technologies, people expect them – on their own — to be the panacea to all their reporting ills. Companies viewed solutions like these as a kind of technological magic pill that would turn middling metrics into incontrovertible insight.
Unfortunately, that’s not how most technologies work – BI included.
BI does not consist of a single technology; solutions such as the above (often referred to as ‘data visualization tools’) are only part of a holistic BI universe. And without the other components, there are a host of challenges that can sidetrack (or even disable) a BI implementation.
First, there’s the technical effort required to install and configure a BI solution — usually requiring a team of programmers and data analysts. Then there’s the implementation time, with installations taking weeks, if not months to complete. And lastly there’s the cost, often in the tens of thousands of dollars.
So – beyond data visualization, what are the essential building blocks for a successful BI implementation?
They are:
- Data cleansing and optimization
- Automated data modeling
- A ‘library’ of preconfigured reports, dashboards, and KPIs
These components – why they are needed, how they work and their impact within a typical BI implementation – are detailed in the following sections.
BI Component #1: Data Cleansing & Optimization
Just like a chef depends on good ingredients, a BI technology depends on good data. And let’s face it – “bad data happens”. Some goes missing, some is erroneous, and inconsistencies inevitably occur. Add to that the mountains of detail in most transactional apps (much of which is unneeded for analytics) and you’ve got a recipe for analysis paralysis and reports that take forever to run.
Even worse, the people who rely on these analytics sense the presence of bad data and stop trusting what the reports are telling them.
The BI component required to address this is challenge is found in a data warehouse with ETL functionality. ‘ETL’ stands for ‘extract’, ‘transform’, and ‘load’ – and that’s exactly what it does. Your data is extracted from its source location (not all of it; only what’s needed for analytics). This data is then cleaned (so you can say goodbye to erroneous, missing, and otherwise bad data). And the transformation completes with the data being loaded into a highly-optimized SQL server database.
The result? Exponentially faster report execution (think ‘from hours to seconds’), improved drill-down (due to standardized data), and more accurate metrics (think ‘single version of the truth’).
BI Component #2: Automated Data Modeling
Note the emphasized text in the following description of business intelligence:
BI is a powerful decision-support technology that uses metrics and KPIs defined in your data model.
There’s the rub.
In order to make the best possible use of your selected data visualization technology, you must first model your data and define corresponding metrics. This is typically (read “almost always”) a manual process. Data modeling takes weeks or months), requires the service of savvy data analysts, and (correspondingly), very deep pockets.
The BI component required to address this is automated data modeling. Auto data modeling is the most important aspect of BI initiatives. It currently exists for ERP and CRM apps and – critically – is application-agnostic. Auto data modeling is based on the concept that every app of a certain type (e.g., ERP apps) share standard components (e.g., ‘customers’, ‘items’, etc.). Auto data modeling uses those data points to create thousands of metrics. Additional metrics (such as for app-specific data points) are then automatically created via app-specific modeling.
Auto-modeling does in minutes what used to take weeks or months. It’s a game-changing component for business intelligence, and it empowers a BI solution with a low total cost of ownership (TCO) and immediate ROI.
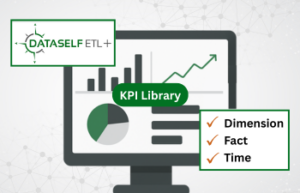
BI Component #3: A Library of Preconfigured Reports, Dashboards, & KPIs
The preceding section states that business intelligence solutions “use metrics and KPIs defined in your data model”. That statement deserves an asterisk.
The referred-to ‘metrics and KPIs’ assume that you’ve designed, created, and tested the reports and dashboards that contain those metrics.
This is a key point, as most data visualizations tools (like Tableau, Power BI, and Excel) are themselves application-agnostic. They can’t provide the thousands of reports they’d need to adequately support the most popular business applications today. To supply even the most basic reports for a handful of popular
ERPs like Acumatica, Microsoft, and Sage would easily exceed a thousand report and dashboard templates.
But the issue of report design via data visualization technologies goes deeper than that. Although most anyone can create a simple report – like a customer list, the expertise to design reports around cash flow, inventory projections, and sales variances is significant. You need database schema knowledge. And – should you want reports with features like slice-and-dice and drill-down, the necessary skill and time increases exponentially.
The final BI component required to address this is a reports library — specific to the business applications used by your organization. Such a library will typically contain hundreds of reports for a given application; they will include histories, trend analyses, and projections. They will include comparisons, anomalies, and exception reporting. They will support drill-down and slice-and-dice, and will come in many formats, including dashboards, charts, graphs, and geographic distributions.
They are – to put it simply – nothing that you would want to design yourself or pay analysts to design for you.
The Bottom Line
Business intelligence is a technology whose time has come; it represents such an advance in analytics and decision-making that in time, no company will operate without it. But – it’s critical to understand that ‘BI’ doesn’t refer to a single solution or technology; it refers to collection of BI-related technologies that include data visualization, data warehousing, automated data modeling, and a reports library.
Without all of these BI components working together, issues of cost, time, and required expertise will grow exponentially and become unmanageable.
With these components, however, BI implementations can be ready in under a week, with little technical expertise, and a low total cost of ownership.
A successful business intelligence implementation is a multi-component endeavor. If your BI installation includes all of these essential pieces, you have the building blocks to a truly data-driven culture and a resource for decision support better, faster, and friendlier than any you’ve had in the past.
DataSelf: We Supercharge Business Intelligence
DataSelf is pleased to partner with leading Business Intelligence, ERP, and CRM solutions to provide clients with a comprehensive BI solution that includes data warehousing, automatic data modeling, and the industry’s most extensive reports library.
Contact us today to learn more about how DataSelf can specifically benefit your company’s reporting and decision making.