The 10 second rule is our litmus test that your Business Intelligence(BI) software is performing well. If this isn’t the case in your situation, it might be time to discover why and how to fix this. Waiting for data to process is the last thing you need to be waiting for, as there are faster and more affordable solutions available.
In this blog we will take the hood off of our BI solution, DataSelf Analytics. Our goal in doing this is to help explain how a BI tool is designed to expedite report running times, along with other key components of a good BI solution that improves performance.
Remember, the 10 second rule is a benchmark. If you are waiting longer than this for your reports to process, the architecture of your solution should be reviewed.
DataSelf Analytics Architecture
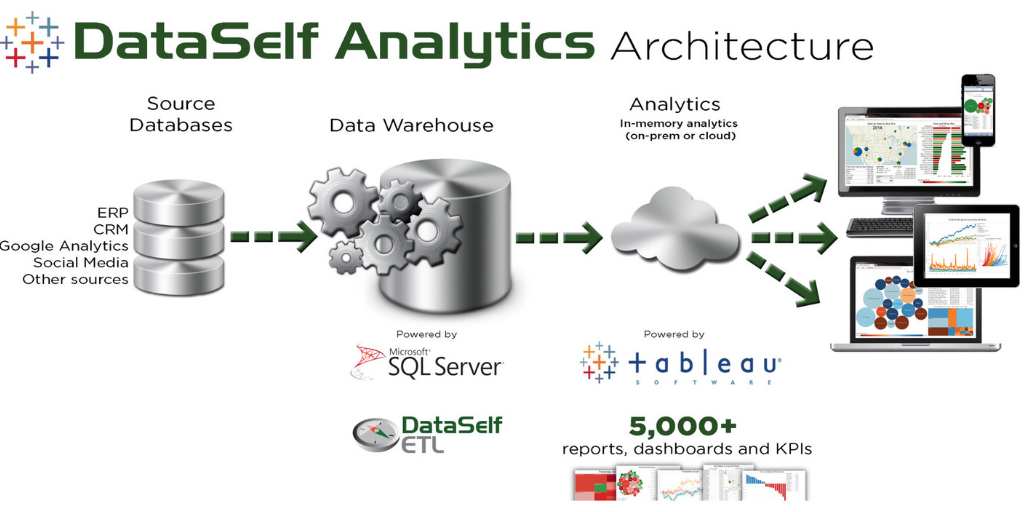
In the DataSelf platform, we use enterprise-grade BI components to deliver speed and ease-of-use. The foundation for quick data processing benefits from MS SQL server for data warehouse technology and Tableau or Power BI for analytics.
Some of our clients have tables with hundreds of millions of records that are brought in from different systems.
Using enterprise-grade data warehousing and analytics tools ensures that reports are delivered in seconds despite how many table links you have, how much data you have, or how complex your calculations are.
Fine-Tuning Your Reporting Platform
We have had clients that come back to tell us it’s still taking hours to run reports.
In one case, a client had just upgraded all their servers in hopes of speeding up their reports. Their overnight refresh was taking over 15 hours to process and something needed to be fixed. When they upgraded the hardware to the latest and greatest servers, they reduced processing time to 12 hours (20% faster).
We were invited into this opportunity to help fine-tune the process and optimize for performance. After diagnosing the issues and tapping into the BI expertise of the team, refreshing the entire DataSelf system was reduced to 2 hours (83% faster!) and that fine-tuning work cost less than half the cost of the new servers.
The bottom line is that having an enterprise BI tool is a huge piece to expediting your reports. Having a trusted partner that not only understands BI software, but also your unique needs, is a key component to fine-tuning your overall process.
Batch-basis Data Processing
In the scenario above, you may be wondering why the refresh process took 2 hours. Clearly this is not 10 seconds.
Data crunching, especially when you have large data volumes, usually requires data processing on a batch basis.
Batch-basis data processing is usually done overnight and is a process of taking all of the data, linking all the tables, and doing most of the pre-aggregation of your metrics on a scheduled-basis.
The result is seen the next day when you open reports and press the refresh button. There’s no need for any calculations and reports are ready to go in a few seconds.
DataSelf’s refresh process can import your data using one of the following approaches:
- Live connection: Reports are directly connected to your live system. This works great when reporting from small data sets.
- Full data refresh: Data tables in DataSelf are completely refreshed on a batch basis.
- Append: This works well for specific tables that only need data appended on an ongoing basis.
- Replace with control: This is a popular approach for large tables that might have recent records updated (for instance, refresh only records for the current fiscal period or year).
- Update: This is a new approach that works with source tables that have a Last-Modified-Date column. This feature only imports and updates records that have changed since the last refresh.
Reporting on Live Data via Reports or Dashboards
It is possible to build great reports that are refreshed every few minutes, or even in real-time. To get this type of performance, use a BI tool that’s been built with an enterprise-level framework that performs updates or partial refreshes for smaller tables.
In a dashboard, you might have several quadrants that bring in historical data with a lot of information and only refresh overnight, while other quadrants can come live from the source system. In this manner, you can have a blend of historic analysis and live analysis together in the same dashboard.
Understanding how your BI tool has been designed, and what components it’s operating on, is important. By using a BI solution that incorporates data warehousing and enterprise level analytics, you will receive the results you’re looking for, including reports and dashboards in under 10 seconds.
See what an enterprise level BI solution looks like with a Free Trial of DataSelf Analytics.
Contact us online or call us at (888) 910-9802 to expedite your report running time.