Is Your Inventory Working for You?
 Calculating Financial Efficiency: The Speed of Stock
Every company has “best sellers”. For some organizations, those best sellers don’t change. But for other organizations, best-sellers are a fluid proposition. A product that flew off the shelf last month could sit and gather dust this month. And so the importance of measuring the “speed of stock” becomes paramount. Seasonal variances, changing tastes, and evolving technologies all contribute to an item’s popularity.
And it all boils down to a sophisticated calculation called “inventory turnover” – a measure of how efficiently a company uses its inventory by dividing the cost of goods sold by the average inventory value during a set period, as is calculated below:
(Cost of Sales)/(12 x (Avg Cost OH))
The desired result of this calculation is an inventory “turnover rate” – the rate at which a company sells and replaces inventory over a specified period of time.
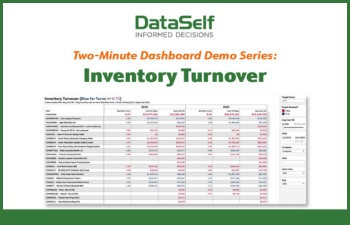
DataSelf’s “Inventory Turnover” Report
At the highest level, the “Inventory Turnover” report is designed to give users an ultra-quick snapshot of which inventory items are being stocked and sold in an efficient manner, and which are not. Color-coding (blue for ‘efficient’, red for ‘inefficient’) provides that awareness. Users determine what their minimum and ideal turnover rates are, and each item’s ‘efficiency’ is calculated for your organization.
In addition to the specification of “minimum acceptable turnover rate” (which defaults to .75), the Turnover report also allows you to specify other criteria, including an item’s average cost on-hand, date range for transactional analysis, and selected items, classes, and sites.
Business Analytics Provided:
With the Item Turnover report, you can identify:
- How often your business turns over its inventory over a period of time (e.g., months or years.) Using this calculation, you can then divide the days in the period by the turnover rate to generate the number of days it takes (on average), to sell each of your items.
- Which items are turning over most efficiently. This information helps you make better decisions on pricing, promotions, and other item-specific marketing campaigns.
- Items with an unacceptably low turnover rate. This usually is an indicator of either (or both) weak sales or excess inventory.
- Items with an abnormally high turnover rate which — although indicative of strong sales — may also be a warning of inadequate inventory stocking.
- Seasonal factors, cost changes, or other financial policies affecting an item’s turnover rate.
Check out this two-minute video demo of DataSelf’s Inventory Turnover report here >>