Sage X3: Analytics for Accounts Receivables (& Identifying Potential Bad Debt)
 When it comes to corporate risk, one of the greatest threats facing a business is clients who fail to pay for their purchases – and the undesirable consequences of having to write off bad debt.
For Sage X3 users, the one report that CEOs, CFOs, and finance staff turn to most often to help them avoid bad debt is the A/R Aging Report. This report shows how much each client owes, what’s past due, and by how far (i.e., over 30, 60, 90, or 120 days).
But . . . as popular as X3 A/R Aging is, it doesn’t tell the whole story.
Common A/R Struggles
- Identifying group-specific debt – those clients in a specific region, or within a specific industry – that have been hit harder by economic volatility and less able to keep up their payments.
- Highlighting clients with an abnormal debt-to-risk ratio.
- Easily spotting inconsistencies and anomalies in client payment habits.
- A lack of meaningful analytics to quickly identify potential bad debt.
- Gaining visibility into staff member effectiveness in terms of debt collection.
The DataSelf Difference:
DataSelf’s analytics for Sage X3 receivables go beyond the traditional “who’s past due?”, “how much do they owe?”, and “how late are they?” This includes:
- Aggregated aging analytics totaling high-risk debt by customer region, industry, or type, including multi-level roll-ups and drill-down to invoice level details.
- “Risk distribution” analysis, to identify clients with an unacceptably high percentage of receivables in the highest-risk debt categories.
- Payment trend analytics, to look for changes in client payment habits, such as an increase in high-risk debt by clients who typically pay in a timely manner.
- Heat charts, which use color-coding to visually represent the distribution of clients’ low, medium, and high-risk debt totals.
- Debt management efficiency, comparing the effectiveness of various account managers at getting clients to pay their debts in a timely manner. (Best performers can be leveraged to share their collections techniques.)
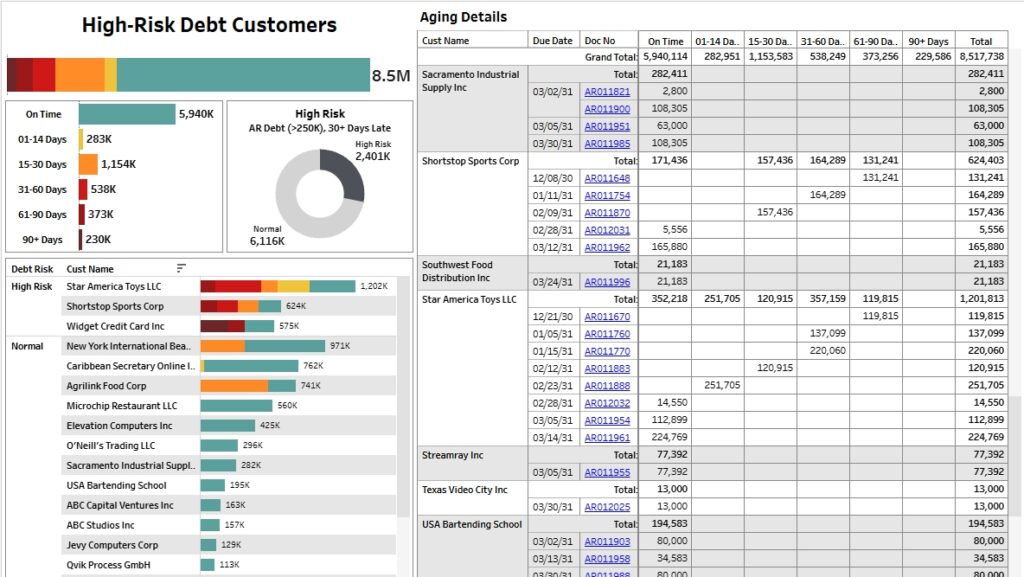
DataSelf’s BI-based A/R reports improve X3 users’ visibility into client obligations. By combining high-level aggregates, trend analysis, graphical analytics, and collections performance, businesses can minimize risk while maximizing on-time payments.
View the High Risk Debt Customers Dashboard in action here.