Telling your data story in seconds takes art, science, experience, trial, and error. In this series, we’ve looked at many facets of data stories including introduction to dashboards, how to use color, chart types and formatting, experimenting with dashboards, visualizations to avoid, and where to put data on a dashboard.
Bringing everything together, let’s look at the 360-degree view dashboard created by the CFO of one of our clients.
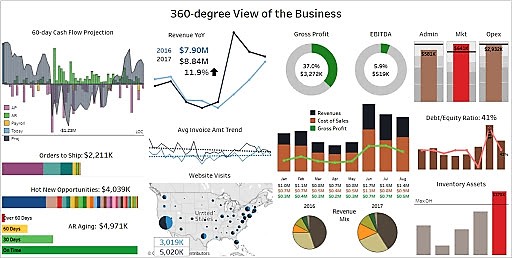
In the top left quadrant, you’ll notice the 60-day Cash Flow Projection, where a CFO sees data like:
- Inbound money
- Outbound money
- Payroll
- Payables
- Cash on hand today
- Projected cash flow over the next 60 days
This cashflow section allows the CFO to do what-if scenarios. For instance, if a client delays payment, will the company run short of cash?
The entire left section of the dashboard is for lead metrics looking into future trends. Things that are supposed to come in the next 60 days—cash flow, orders to ship, and opportunities to be sold from the CRM system—all these charts are interactive allowing users to drill into details.
An Interactive Dashboard
In the central column, you can tell that blue communicates data from last year and black represents the current year. The entire column has the same color legend, so it’s a very clean, uncluttered perspective.
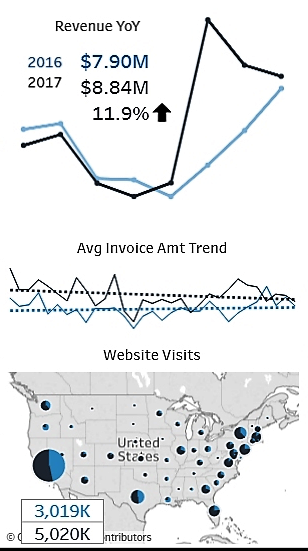
Using DataSelf’s Dashboard 2.0 technology, all the data is interactive. As a CFO clicks on information, the whole report will change. Dashboard data showing in red usually reflects negative numbers that need close attention.
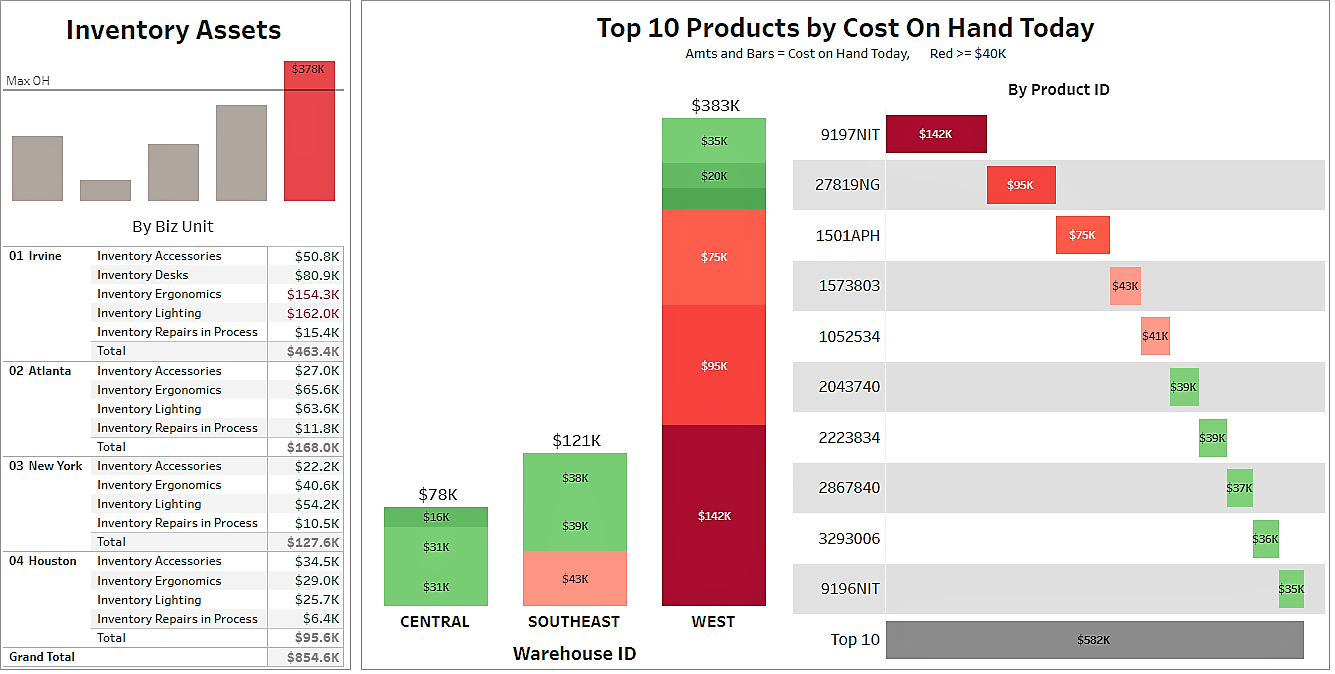
Clicking on the Read Inventory Asset allows a CFO to drill down into more details within the dashboard where he can continue to assess and see what’s going on.
Comparing Dashboards
Below is a very different kind of dashboard.

This one is somewhat distracting, in a way, but geared towards people who will be viewing sparingly. But, when someone views it, it needs to communicate a data story quickly and make an impression.
Choose the Right Dashboard
A dashboard like the one above could be used for board meetings. It’s extensive, and while you scroll down you see lots of pictures and explanations.
Every business has their own unique data story to tell. Readers will vary and developing the right dashboard to communicate the right information in an easy to digest format will propel insight and action.
Telling your data story and creating different dashboards is easy using DataSelf. Download a free trial to get started. We are here to help you make the most out of your data. If you want to speak with a Dashboard Expert, contact DataSelf online or call (888) 910-9802.