Top Performers Across Customers, Products, Regions, and More
 Whether it’s hot customers, hot items, or hot regions, the thread that links all of these together is your desire to know “what’s hot”. DataSelf understands this need, and instead of requiring you to run different reports for each “dimension” (e.g., customer, item, or region), you’re provided with a single report from which you may select which dimension you wish to analyze.
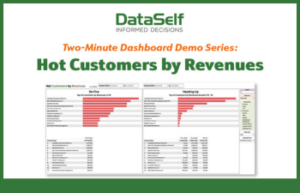
The Hot Customers by Revenues report is a perfect example. On the right-side of this report, you can choose from a pre-configured (and customizable) list of twelve different dimensions. Among the most popular are customer, item, and salesperson. Note that although this report totals revenues, it may also total gross profits, cost-of-goods sold, and quantity sold.
Here are the top business insights from a “Hot Customers” report:
- . . . who are your top revenue-producing clients
- . . . whether many of your top clients are from the same region
- . . . whether certain salesreps have a majority of top clients
- . . . whether most of your top clients are buying the same products
- . . . which clients are growing their revenues the fastest (& by how much)
- . . . whether your fastest-growing clients are from the same region
- . . . whether your fastest-growing clients belong to the same salesrep
- . . . whether your fastest-growing clients are buying the same products
Keep in mind that all of the above insights – which relate to the revenues generated by your top revenue-producing customers and customers with the greatest revenue growth – can also apply to any other dimensions you wish to analyze. So, whether it’s top revenue-producing items, or regions with the greatest revenue growth, this one report can provide a wealth of business insight across your organization.
The report includes the following components:
KPIs: total revenues, gross profit, COGS, quantity sold
Totaled by: 12 default, customizable fields including customer, product, salesreps, region
Selectable by: item, salesperson
Timeframe: two selectable time periods (for both revenues and revenue growth)
Special: ability to select “top x” records, such as “top 12 customers by revenue”
See this report in action here >>
…And this is just one of the many fully customizable inventory management reports DataSelf delivers – ready to use right out of the box.