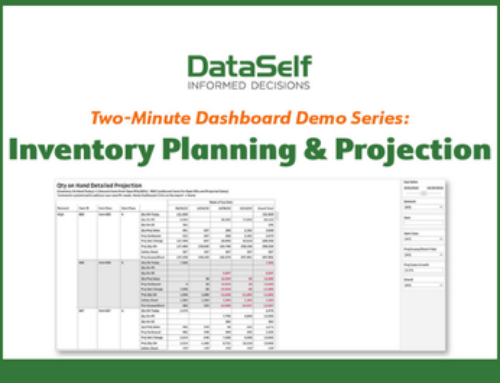
The Next Evolution in Enterprise Reporting: A Galactic View of Your Business Data
In the world of reporting and analytics software, changes occur fast and frequent. ‘Natural-language searching’ was heralded as the next thing . . . until AI came along. ‘Slice and dice’ was the be-all and end-all . . . until infinite drill-down came on the scene. And ‘scheduled report distribution’ was a godsend . . . until sub ten-second report generation arrived.
The Future of Data Modeling
As users who have grown accustomed to such improvements, we often fall into the trap of thinking that some developments have reached their ultimate conclusion – the “it can’t get any better than this” syndrome. Just such an attitude has seeped into the concept of data modeling. Modeling, as you may recall, is defined as:
“ . . . the process of creating a blueprint or diagram that defines the logical structure of a database by showing how data is organized, related, and stored.”
Modeling relies on a holy trinity of measurements – dimension, fact, and time (also known as ‘DFT’). The creation of DFT measurements is typically a manual process but is now available in an automated capacity. The hundreds (or thousands) of measures that are created are then made available to data visualization tools such as Microsoft Power BI™, Tableau™, and Excel™ (to name just a few).
It’s important to note that the automated data modeling process referred to above is powered by artificial intelligence (AI). Without AI, modeling is both a lot of work as well as a considerable expense. As the power behind automated modeling, AI draws upon countless industry examples of application types such as ERP and CRM. Using these examples, AI is able to ‘figure out’ the fields, relationships, and workflow that go into a typical data model.
And it’s just this automated data modeling with DFT creation that makes us think that we have achieved reporting nirvana; our ‘data journey’ is over and we’ve arrived at the point of ultimate analytics.
Well . . . almost.
A more accurate description of our arrival station would be penultimate analytics.
Automated data modeling and DFT are an incredible boon to reporting; but there’s still one restriction that hampers truly great analytics – a restriction that is both conceptual and technical in nature.
When we run a report today, we think of it as application (or database) specific. It’s an ERP report . . . or a CRM report . . . or a financial report. The report uses the data model (and DFT measures) specific to that application’s database.
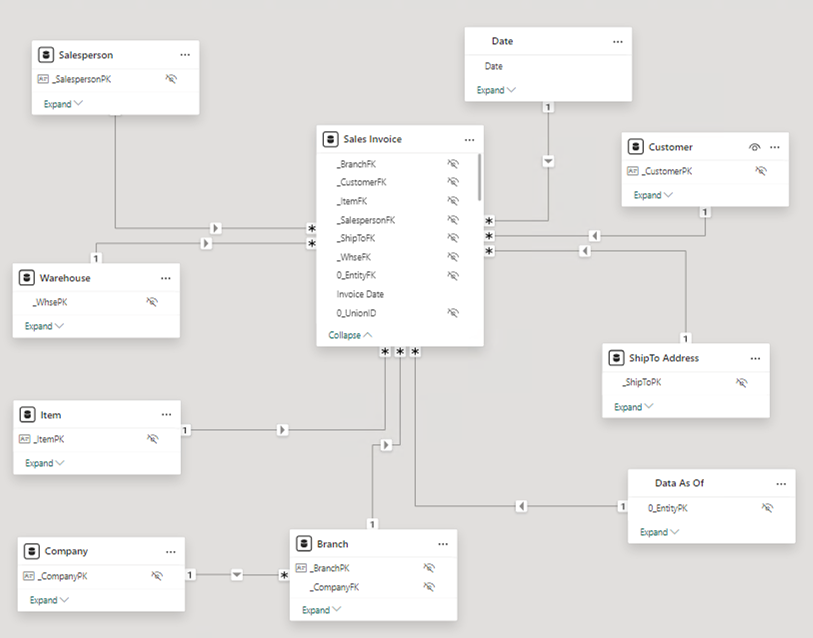
The Star Schema
This data model is technically referred to as a ‘database star schema’. It traditionally uses a central ‘fact’ table, around which are multiple ‘dimension’ tables – thus taking on a star-like appearance. The construction of the star schema simplifies and expedites the reporting process by minimizing the number of connections (or ‘joins’) between the tables.
All of the data and corresponding tables needed for analytics are part of the star schema – such as customers, products, orders, and the like. Each application is the ‘star’ of its own schema.
But . . . as any astronomer will tell you, sometimes in order to understand what’s happening with a given star, you need to look at the stars around it. A ‘star schema’ is not always enough to give you the truest picture of business activities and business impact. What’s needed is a bigger picture — a ‘galactic picture’ – and both astronomers and analysts have struggled to gain that larger perspective.
…until now.
The Galaxy Schema
The galaxy database schema came into being because organizations realized that it’s no longer sufficient to base critical business decisions on the data present in just a single star schema. Thus, the vision of the galaxy database schema is to expand the number of data sources a single report can draw from, order history, for example (from an ERP app), needs to be able to be joined with receivables (from the ERP) and open opportunities (from a CRM app).
Effective cross-enterprise reporting depends on the presence of a galaxy database schema.
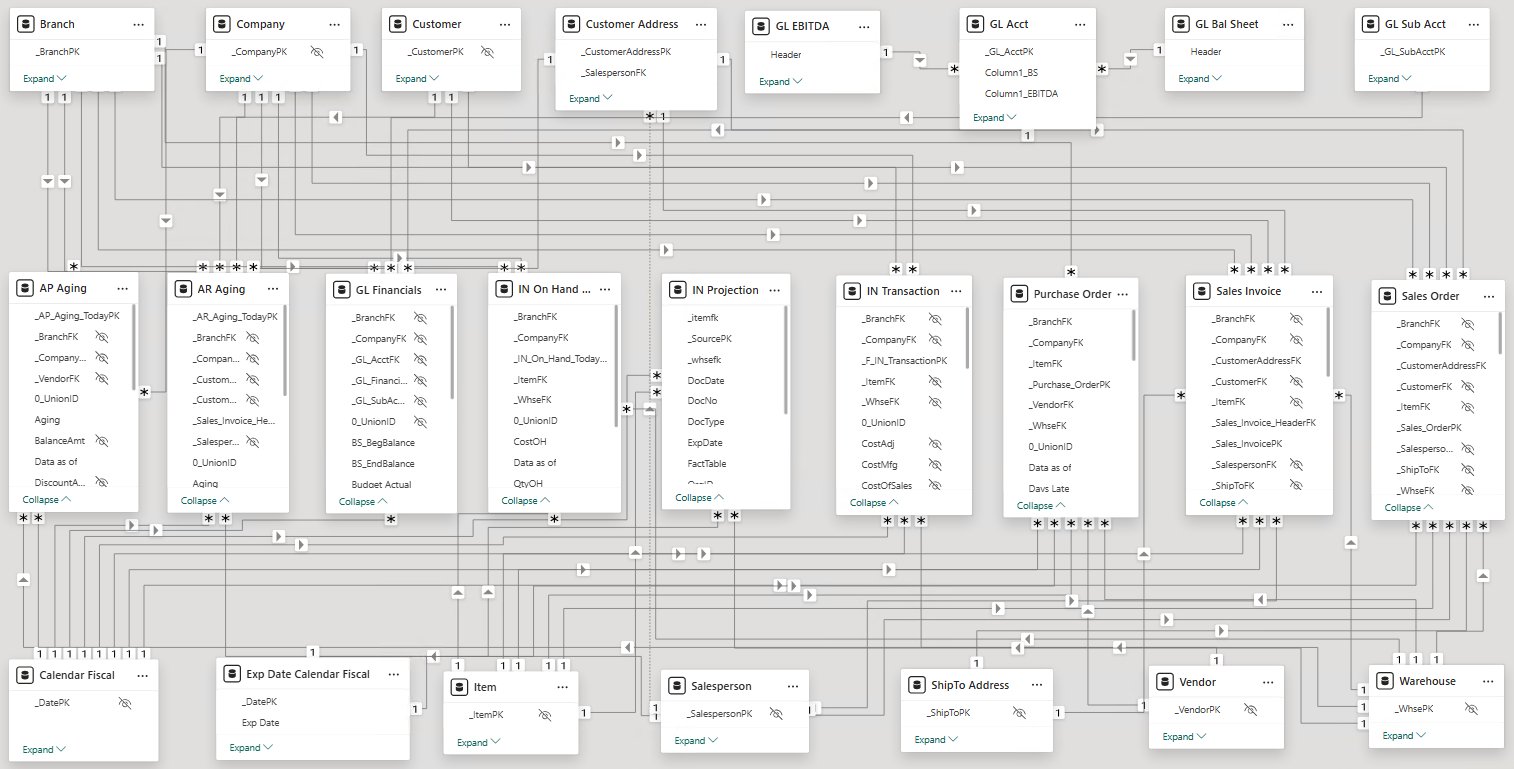
Also referred to as a ‘fact constellation schema’, the galaxy schema expands the use of a data warehouse to contain multiple star schemas – each of those star schemas using ‘fact’ tables that share common dimensions across the multiple applications. A good example of this is a galaxy schema that contains star schemas for ERP, CRM, and finance – all of which share certain data elements such as ‘customer’, ‘product’, and ‘salesperson/employee’.
Under normal data modeling (using star schemas only), data from different applications would need to be reported on separately and then manually (and painstakingly) merged, such as the analysis of sales by product versus inventory quantities by product. But – using a galaxy schema, both of these analyses would be based off of the same dimension (product), and thus able to be generated in a single report or dashboard.
The impact of galaxy schemas for organizations that have sophisticated analytical needs – typically storing larger datasets in data warehouses – is immense. Interconnected business processes make galaxy schemas a necessity. Multiple data sources are unified, while at the same time maintaining their own separate ‘facts’ for KPIs. Business insight – and the decisions that result from that insight – are unequivocally improved, with the dreaded “but I didn’t know about that!” riposte banished from reports forever.
DataSelf: We Supercharge Business Intelligence
DataSelf is pleased to partner with leading reporting and BI technologies to provide clients with a comprehensive solution that includes data warehousing, automatic data modeling, and the industry’s most extensive reports library.
Curious if DataSelf is the right fit for your business? Let’s talk through your data challenges and goals to see how our technology can help you deliver faster, more reliable insight.