The SMB Analytics Wire – December 2025
DataSelf Releases ‘ETL+ 2026’ for Next-Gen Business Intelligence
Expedites Report Prep & End User Experience
 San Jose, CA — 12/2025 — DataSelf Corp., the mid-market leader in BI-based analytics, today announced the release of DataSelf ETL+ 2026, a next-generation suite of business intelligence solutions that replaces inefficient, disjointed, and outdated BI technologies with an AI-driven suite of integrated and automated solutions.
Uniquely combining data warehousing, automated data modeling, and extensive KPI libraries, ETL+ 2026 represents a new approach in holistic, end-to-end analytical reporting – built on modern technology.
AI + Automation: Next-Gen Reporting for Acumatica
 Acumatica provides a solid foundation for business management and core reporting. But as organizations grow, their data needs evolve quickly. Teams begin asking more complex questions, leaders need faster visibility, and decision-makers require insights that go beyond typical reports.
Eventually, many businesses reach a point where their existing reporting tools—while reliable—aren’t enough to support the next stage of growth.
Supercharged BI, Reporting & AI for Sage
Sage ERP systems provide dependable operational visibility and solid built-in reporting. For many organizations, this foundation is more than enough—until growth, complexity, or new competitive pressures demand more.
At a certain point, business leaders need richer analytics, quicker access to key metrics, and tools that help them see ahead rather than simply documenting what has already happened. As these expectations rise, the need for more robust BI capabilities becomes clear.
As Sage customers expand into new markets, add product lines, or scale operations, they begin encountering reporting challenges that weren’t as visible before.
DataSelf Analytics for Manufacturers
 Manufacturers are the best examples of multi-taskers; from BOMs and work orders to budgets and cash flow, manufacturers have a level of awareness that is almost superhuman.
But even manufacturing superheroes can be caught by surprise:
- Insufficient inventory to fulfill current projects
- Incomplete work orders (missing components)
- Costing mistakes
- Out-of-date (or inaccurate) bill of materials
- Forgetting to plan for preventative maintenance
- Scheduling conflicts
Most – if not all – of these challenges can be traced back to one overriding issue – a lack of real-time visibility into manufacturing processes via reports and dashboards. Without this insight, you can’t effectively prioritize work orders, you’re left with inaccurate and unreliable forecasting, and you’re unable to analyze the performance of your staff and suppliers. Cost overruns and project delays become a daily battle.
Understanding Business Intelligence: The BI Building Blocks You Need for Next-Generation Analytics
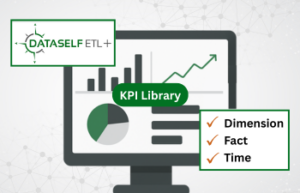
Implementing business intelligence (BI) is one of the smartest moves a company can make – but BI alone isn’t enough. Many organizations underestimate the cost, time, and complexity of deploying BI tools like Power BI, Tableau, or Looker. The real key to success lies in combining BI with three critical components: data cleansing and optimization through ETL and data warehousing, automated data modeling to rapidly define meaningful metrics, and a rich library of preconfigured reports and dashboards. Together, these elements transform BI from a slow, costly project into a fast, reliable, and insight-driven solution that empowers better decisions across the organization.
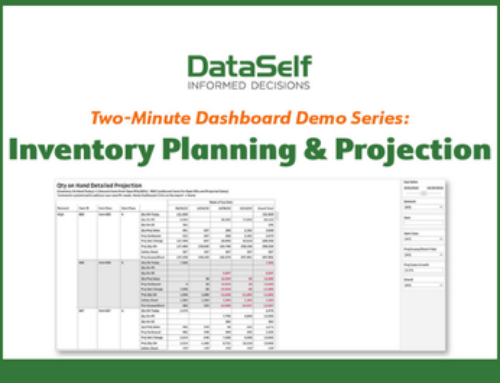
Days of Stock Report: Business Insights Provided
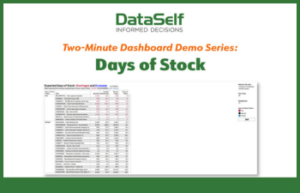 Focus: Fulfillment, just-in-time inventory, stock outages & overstocks
Managing inventory to reduce your chance of stock shortages – while also not keeping an excessive quantity on-hand – is a balancing act that every company with a standing inventory struggles to achieve. Predictions based on historical consumption and replenishment are the best way to attain this goal.
The Days of Stock report does exactly that; it uses the history of item sales and purchase orders to forecast likely future needs. Adopting a color-coding scheme, it identifies items facing a probable shortage in the near future, items whose on-hand quantity is sufficient to address future needs, and items clearly in an overstock status.
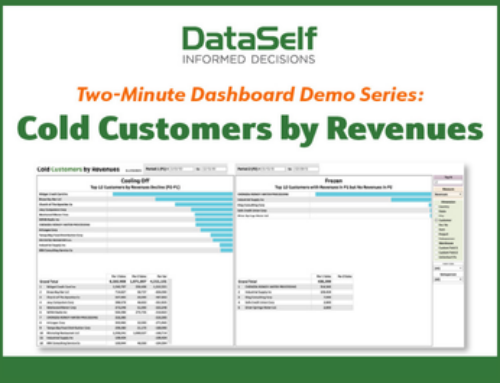
Top Performers Across Customers, Products, Regions, and More
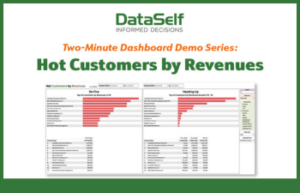 Whether it’s hot customers, hot items, or hot regions, the thread that links all of these together is your desire to know “what’s hot”. DataSelf understands this need, and instead of requiring you to run different reports for each “dimension” (e.g., customer, item, or region), you’re provided with a single report from which you may select which dimension you wish to analyze.
The Hot Customers by Revenues report is a perfect example. On the right-side of this report, you can choose from a pre-configured (and customizable) list of twelve different dimensions. Among the most popular are customer, item, and salesperson. Note that although this report totals revenues, it may also total gross profits, cost-of-goods sold, and quantity sold.
2025 Events, Demos and Webinars
 We love getting to meet up with clients and businesses at conferences, webinars and everywhere in between! It is more important than ever that executives and managers have access to clean data and accurate reporting to make better, easier, and faster decisions!
Recordings & Resources
- DataSelf Releases ‘ETL+ 2026’ for Next-Gen Business Intelligence
- AI + Automation – Next-Gen Reporting for Acumatica
- Supercharged BI, Reporting and AI for Sage
- DataSelf Analytics for Manufacturers
- Your ‘What’s Hot’ Business Insights Report
- Unlock Your Stock Story: Smarter Insights in Every Day of Inventory
- 2025 Events, Demos and Webinars! Quarter 4 Update