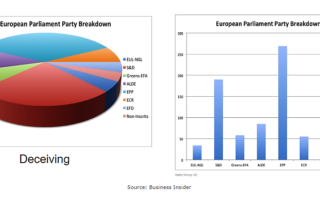
Telling Your Data Story in Seconds, part 5: Visualizations to Avoid
When you’re building dashboards, you should use the right visualizations for the job. The chart you should use depends on the story you’re trying to tell. A chart that works great for certain purposes can [...]
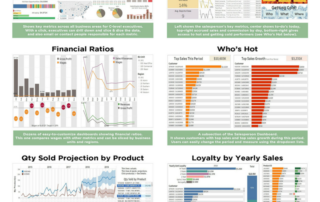
DataSelf’s Dashboard 2.0 Revolutionizes Data Analysis
Newly-released product has wide functionality and versatility Businesses need to sort through scores of data in a short amount of time, and dashboards are often what they use to do it. Everything has to be [...]
The Evolution of DataSelf’s Dashboard
Roman poet, Ovid, once said, “Dripping water hollows out stone, not through force but through persistence.” Through persistence and constant change, we’ve come a long way in the development of DataSelf’s dashboards. The key to [...]
DataSelf Analytics for Acumatica
Among ERP systems, Acumatica provides one of the most empowering reporting platforms. It works great for many organizations. On the other hand, organizations looking for enterprise data warehousing and analytics will find that DataSelf Analytics [...]
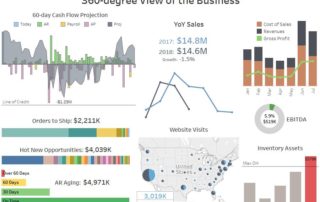
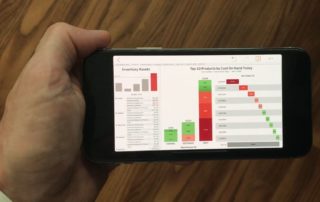
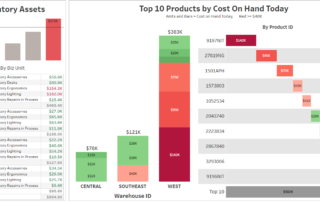
Dashboard 2.0: 360-degree View
360-degree Business View: Clear and Compelling A famous mathematician, John Tukey, once said, “The greatest value of a picture is when it forces us to notice what we never expected to see.” In the business [...]
DataSelf Corp. Announces DataSelf Analytics for Acumatica
Acumatica users can now benefit from DataSelf’s enterprise business intelligence (BI) solutions powered by Tableau, data warehousing and 5,000+ KPIs. Santa Clara, CA - Jun 1, 2018, Acumatica users have a powerful new analytics and [...]