Project Description

Jun 5, 2014
9:00 am-9:30 am PT
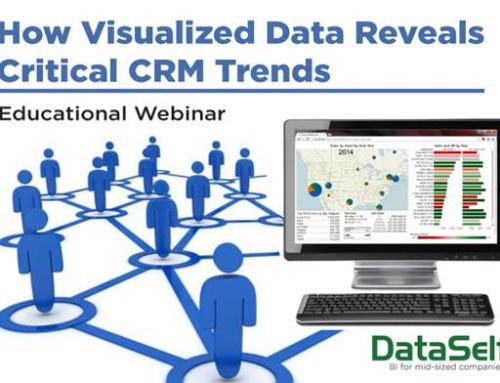
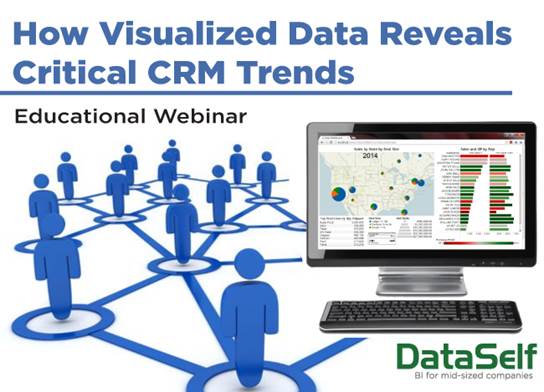
This has probably happened to you: You realize too late that a long-time customer has stopped ordering from you. If only you had noticed in time.The signs are easy to miss. But what if you could see all critical trends in your CRM at a glance — in data brilliantly and clearly visualized. Imagine you could read them all like dials in a cockpit. See the dangers and see the opportunities — as the data comes in, never letting a single one go by unnoticed.
In this webinar, you’ll learn this and more:
• Visualize your data to easily and instantly ensure that your sales funnel has a balance of prospects at each stage. Drill into sticky points with a single click.
• Ensure sales efficiency. Monitor the activities from first contact until closing — and how to drill in to see what’s working and what’s not.
• Monitor tech support to ensure that inbound requests are being resolved promptly. If not, why not?
Setting up these visualizations is quick and easy with DataSelf Analytics, “the Ferrari of analytics for mid-sized organizations,” thanks to its best-of-breed platform based on Tableau and Microsoft BI.
Tell your colleagues!
Who Should Attend:
Business managers of medium-sized organizations who want a stronger competitive edge with better use of CRM data.
Roles: CEO, CSO, CMO, VP of Sales, sales managers and reps, Business analysts, report authors, IT, CRM users.
Speaker:

Joni Girardi
DataSelf
Founder & CEO