Have you ever been in one of your business apps (e.g., ERP or CRM) and wished that you could simply ask it a question in plain English and instantly get a report with the answer you’re looking for?
Welcome to Natural Language Query (‘NLQ’ for short). Relatively new, NLQ empowers users by making it easy for them to get the information they need to make the most informed business decisions.
Even with many analytics solutions including a library of preconfigured reports (DataSelf’s library contains over 8,000), it’s always possible that the one report you need right now . . . isn’t one of those.
NLQ is like Google Search. It enables you to build a report using conversational English (a “natural-language”), instead of having to learn a Report Design Tool. Even with report designing made easy (see the article “Report Design for Frustrated Designers”), you still need to know data structures such as “tables”, “fields”, and the like.
All NLQ requires is that you phrase your request in a logical format. For example, consider how you might use Google Search to find out “what red wines from the Bordeaux region in France were produced in the year 1980”:
Google Search entry: Red Bordeaux wines in 1980
Similarly, with DataSelf’s NLQ, if you wanted to find out “what were the sales for the year 2021, totaled by salesperson”, you would type in:
Sales by salesperson in 2021
The following chart is an NLQ report created instantly from a sample database. If DataSelf were plugged to your data, you’d see your salespeople’s sales in 2021.
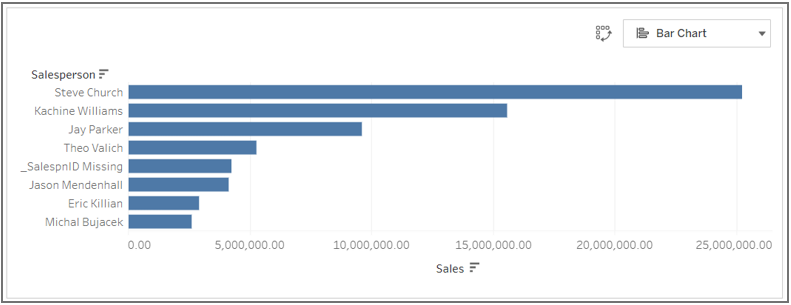
Natural Language Query Results: Sales Per Salesreps in 2021
If you wanted to “dig deeper”, all you need to do is to specify your additional criteria. For instance, to see “sales by salesperson in 2021 by month”, you’d just type in:
By month
And the resulting dashboard would instantly change to this:
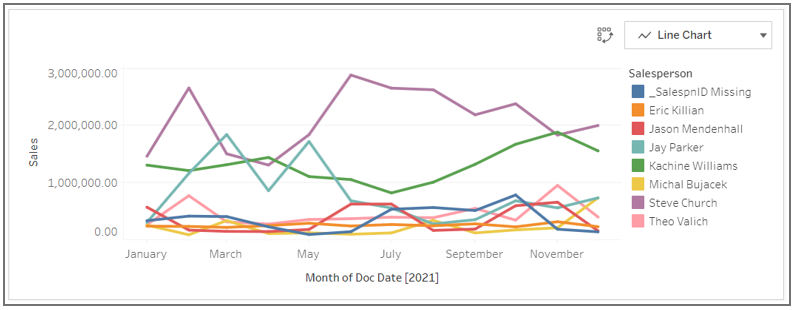
NLQ Results: Sales Per Salesreps in 2021 (By Month)
NLQ even lets you choose the format of the resulting data. For example, to see the above information in a table format, you’d select “Text Table” from the top-right dropdown to see the following:
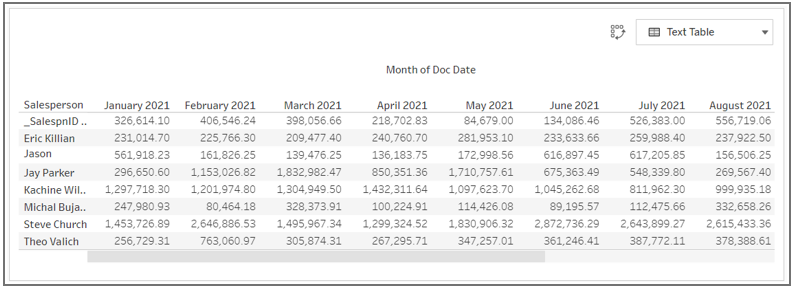
NLQ Results: Sales Per Salesreps in 2021 By Month, Formatted as a Table
You can even output this data into Excel and other formats.
The key to using NLQ is to phrase your commands as you would a Google search. You specify the data you wish to report on (e.g., sales, invoices, calls, etc.), add in your “grouping” and “selection criteria” (one at a time, so you can validate your selections), and view your results.
Here are a couple of other examples of NLQ reports:
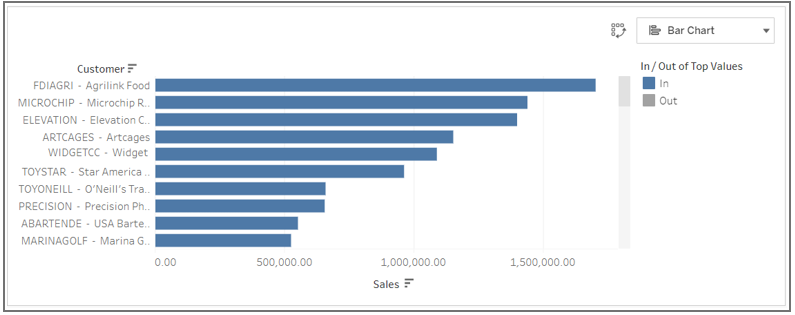
Top 10 Customers by Sales in Q1 2021
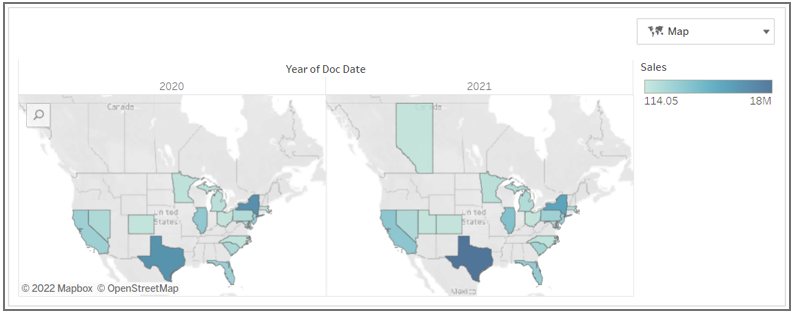
Sales by Ship-To State by Year in 2020 and 2021 as a Map
Like Google, NLQ uses Artificial Intelligence and Machine Learning to understand users’ queries and generate the desired report from the underlying data. (DataSelf uses NLQ engines from Tableau and Power BI. Click here to learn more.)
Keep in mind that just as Google can’t answer all of your questions, NLQ can’t supply all of your reporting needs, as some more sophisticated reports will still require DataSelf’s drag-and-drop Report Designing tool.
For many of your staff’s ad-hoc report requests, however, NLQ is the answer. As long as you and your staff know how to use Google Search (and have passed middle school English!) you’re fully qualified to use NLQ today and get the answers that will help you make more informed business decisions.