When selecting a business intelligence platform (BI), many organizations put too much focus on the cost of the BI software.
Recent surveys show that the long-term labor investment ranges from 2 to 35 times higher than the BI software costs (35 is not a typo!).
Find out how much your organization can save with self-service BI with our ROI calculator.
Is 2 to 35x Good or Bad?
Major labor investment in BI means that either:
- The project is dragging its feet, which is bad;
- Or the system has great user traction, allowing knowledge workers to make more informed and timely decisions, positively affecting the organization’s bottom line. In this case, the labor investment should be paying off big time!
While large labor investment might be an indication of success, many organizations fail to understand that a poorly selected BI platform can be the main culprit of high labor costs.
The two surveys covered in this article shed some light on factors that affect long-term BI costs.
The Right Software Fit and its Long-Term Costs (a Case Study)
Tableau released a Total Cost of Ownership Survey (that continues to be relevant as of 2025) showing that in the first three years of BI projects the labor investments average one order of magnitude greater than the BI software costs (Tableau URL).
This survey also compared the total cost of Tableau versus Power BI.
Here’s one of the survey’s main charts.
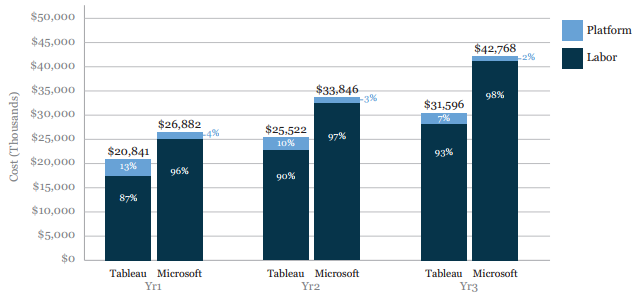
The chart tells us that:
- Over the first three years, the investment in software licenses is a small fraction of the total cost.
- Even though Tableau license investment was about three times higher than Power BI’s, the total cost of ownership in 3 years with Tableau was about 29% lower!!! See below.
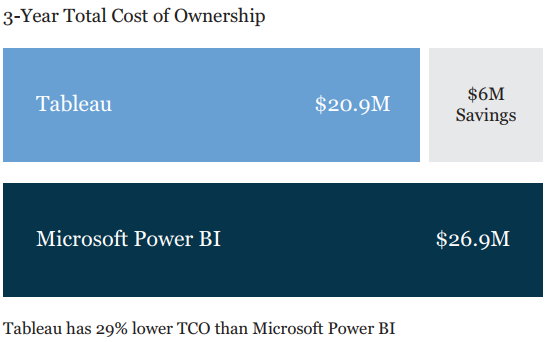
For every $1 an organization invested in Tableau, they invested about $9 in labor over 3 years, while Power BI required $35 in labor. I’m not saying that Tableau is the right fit for all BI projects, the point here is that choosing the right BI software for your needs will make a huge financial difference in the long run.
The bottom line is; don’t cut corners when selecting your BI platform. Remember, the license software cost tends to be a small fraction of the total cost.
Build versus Off-the-Shelf?
The survey above analyzed BI projects using the build-from-scratch approach. This approach is popular and works for many.
When building from scratch, my main advice is engaging people with experience in your selected BI platform, in your source systems, and with at least one person skilled in bridging the communication gap between business users and BI experts. Another important advice is retaining key-people who will be critical for lowering long-term labor costs.
On the other hand, instead of building your BI projects from scratch, you should also check off-the-shelf solutions and vendors that:
- Work with BI platforms that fit your needs
- Come with a rich set of off-the-shelf templates (such as plug-and-play connectors, reports and dashboards)
- Have expertise to support, augment and/or outsource your BI team
These vendors can dramatically reduce the time and cost to get value from the investment, and can augment and complement your BI team as needed.
Off-the-Shelf Lowers Total Cost of Ownership (Surveyed Organizations)
DataSelf recently released a survey shedding light on the 3-year total cost of ownership (TCO) from their clients using DataSelf off-the-shelf BI solutions.
The summary of the survey is shown below (Click here to view the 2017 DataSelf SMB survey). In the chart, each row represents a client that answered the survey, and the bar length represents the total investment in 3-years. According to DataSelf, the sampled projects are a good representation from among their hundreds of deployments including small, medium and large deployments.
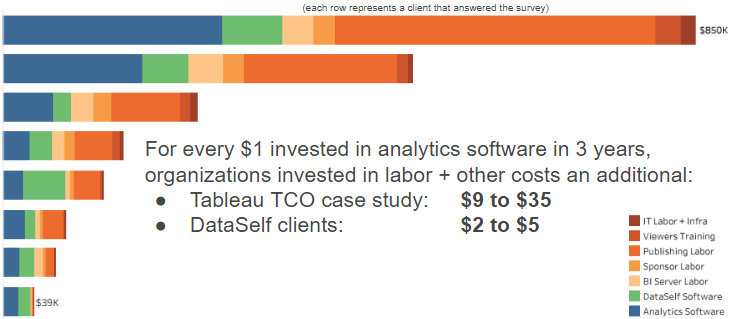
The survey shows that, on average, for every $1 invested in analytics software, DataSelf clients invested a total of $2 to $5 in 3 years (versus $9 to $35 in the Tableau case study).
Why Do DataSelf Clients Spend So Much Less?
DataSelf has found that a good part of an organization’s reporting needs is the same across many industries. For instance, if you have a sales-driven business, regardless of your industry, you’re likely paying close attention to sales metrics and trends from your customers, salespeople, regions, products and/or services. The same applies to other reporting areas such as financials, inventory, receivables and payables. DataSelf offers more than 2,000 customizable report and dashboard templates for ERP and CRM systems as a starting point. (Jan 2025 update: 8,000+ customizable DFT KPI templates).
Instead of creating from scratch, DataSelf clients find ready-to-go and easy-to-customize reports addressing a wide range of needs such as sales, inventory, financials, payables, receivables, purchasing, services, manufacturing, opportunity, contact and tech support management, website visitors, multi-company consolidation, and multi-currency among others. Their platform includes Tableau, data warehousing, and report and dashboard templates targeting organizations using mid-market systems such as Acumatica, Epicor, Infor, Microsoft Dynamics, NetSuite, Sage and Salesforce.
DataSelf’s expertise also plays a big role in reducing labor costs. With hundreds of deployments under their belt, they understand the typical data analysis challenges in their market, how data is populated in mid-market systems, and how to connect the dots using data warehousing, Tableau and their templates as a starting point.
DataSelf claims to deliver in hours or days what would usually take months or years to build from scratch. And the survey above validates their point. DataSelf’s clients are experiencing one of the lowest total cost of ownership in the BI industry!
Calculate your organization’s savings with our Analytics ROI Calculator.